Antonio Brown will probably lead the league in targets this year. But if he doesn’t, the next most likely receiver to do it is Keenan Allen


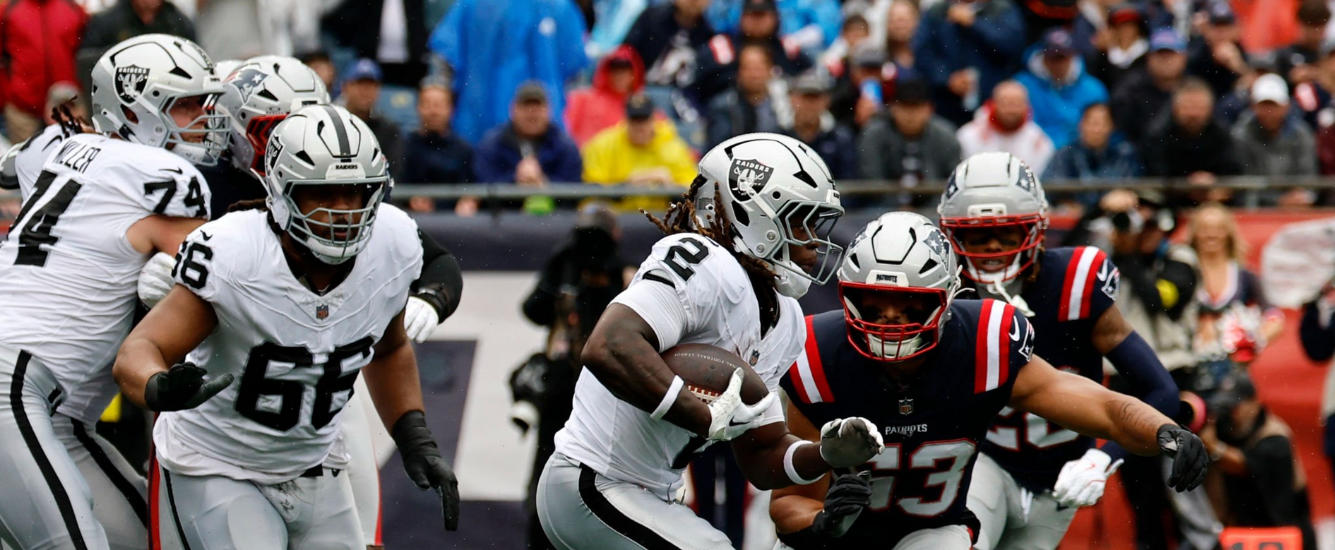
Todd Gurley Is a Bad Third Round Pick
Todd Gurley, the No. 1 non-quarterback fantasy football player in points per game in both 2017 and 2018, is currently being overdrafted in the second round of best ball drafts. Gurley’s ADP has declined in the last month, but it has not fallen far enough. There should be extreme concern about Gurley’s health and his future in the NFL. The Information We Have We know that…...

2019 Rookie WR Tournament Round Two: (1) N’Keal Harry vs (9) Marquise Brown
In the second round of the 2019 RotoViz Rookie WR Tournament, first overall seed N’Keal Harry from Arizona State takes on ninth-seeded Marquise Brown out of Oklahoma. Brown’s draft stock is on the rise, but will it be enough for him to edge out this year’s RotoViz darling, Harry? Read on to find out. Note from Curtis Patrick, RotoViz Dynasty Coordinator: The 2019 RotoViz Rookie…...
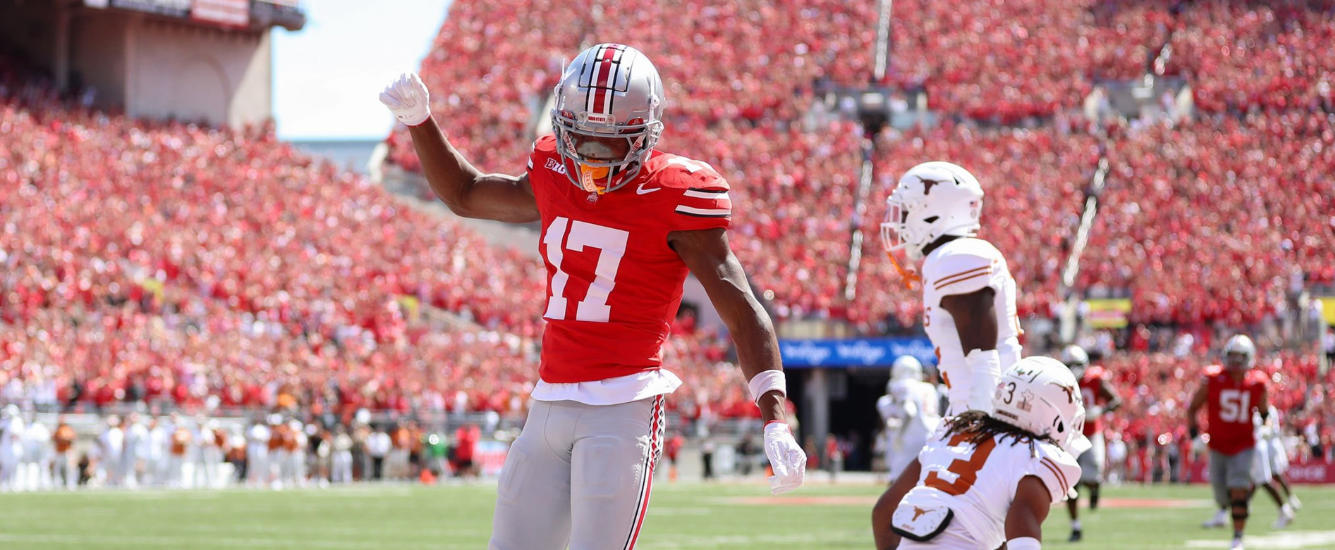
2019 Rookie WR Tournament: A.J. Brown (3) vs Terry McLaurin (14)
In the first round of the 2019 RotoViz Rookie WR Tournament, third overall seed A.J. Brown from Ole Miss takes on 14th-seeded Terry McLaurin out of Ohio State. Is there any hope for McLaurin, or will Brown’s pedigree prove too hot to handle for the Buckeye? Read on to find out. Note from Curtis Patrick, RotoViz Dynasty Coordinator: The 2019 RotoViz Rookie WR Tournament pits…...