


RotoViz’s NFL Player Stat Explorer is the tool you need to efficiently review player performance, peruse game logs, identify trends, consider upcoming matchups, and keep up with the stats that matter.
The tool allows users to easily track points scored per game, weekly positional finishes, expected points, air yards, opportunity, usage, and a whole lot more.
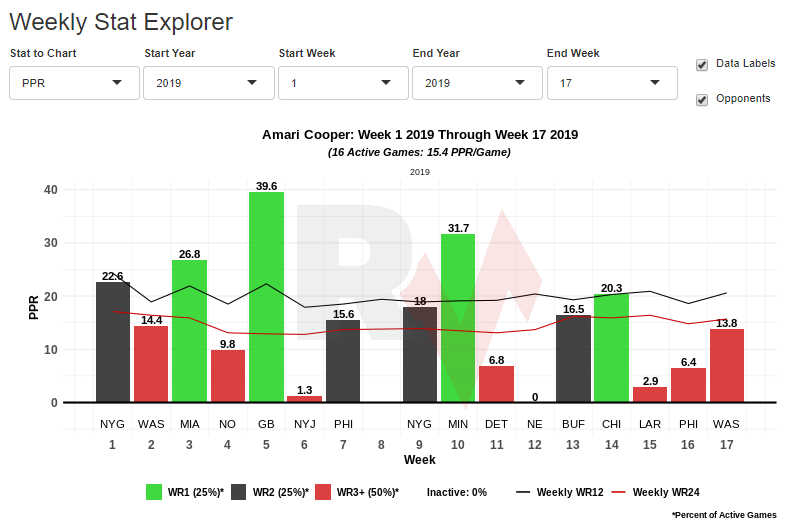


The NFL Weekly Stat Explorer allows users to quickly review fantasy points and a variety of stats from a specific week or range of weeks. Which RB scored the most points between Week 5 and Week 10 of 2019? Who led the Dolphins in receiving yards in the first half of the season? Use the Weekly stat explorer to answer these questions.

The DFS Lineup Optimizer is a fantastic tool for DFS players. It leverages the RotoViz Weekly GLSP projections to generate lineups for Yahoo!, FanDuel, and DraftKings contests. The optimizer allows users to lock and block players from lineups, stack positions, avoid defenses, and build up to 50 lineups at once.
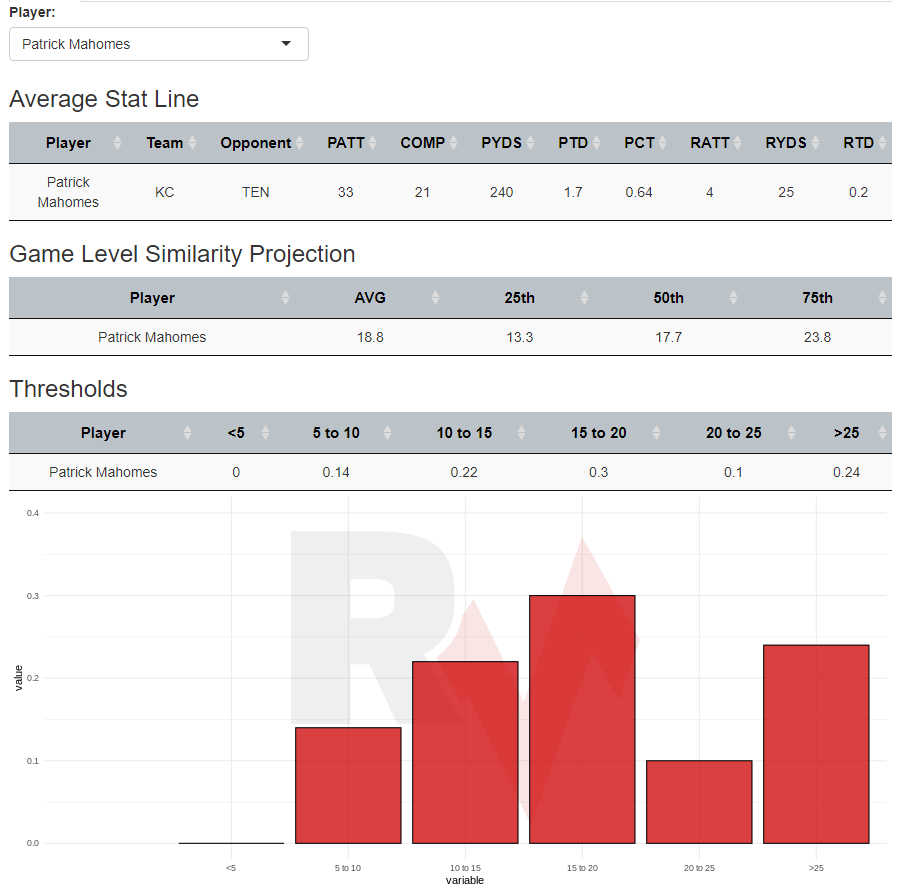
Game Level Similarity Projections (GLSP) use historical data to build weekly projections for fantasy players. These projections are built by identifying the statistics that correlate with fantasy points and carry from week to week. The app uses a player’s stats to “match” him with similar players and then considers the performance of these players when they opposed defenses similar to the one that the player in question will face that week. By compiling these results, the app is able to build an average stat line for the player’s expected performance as well as a realistic range of outcomes. For more information on the process and results check out the links below.
– 2019 Game Level Similarity Projections: Calculating Weekly Fantasy Point Expectations
– Game Level Similarity Projections: Week 1 Ranges of Outcomes


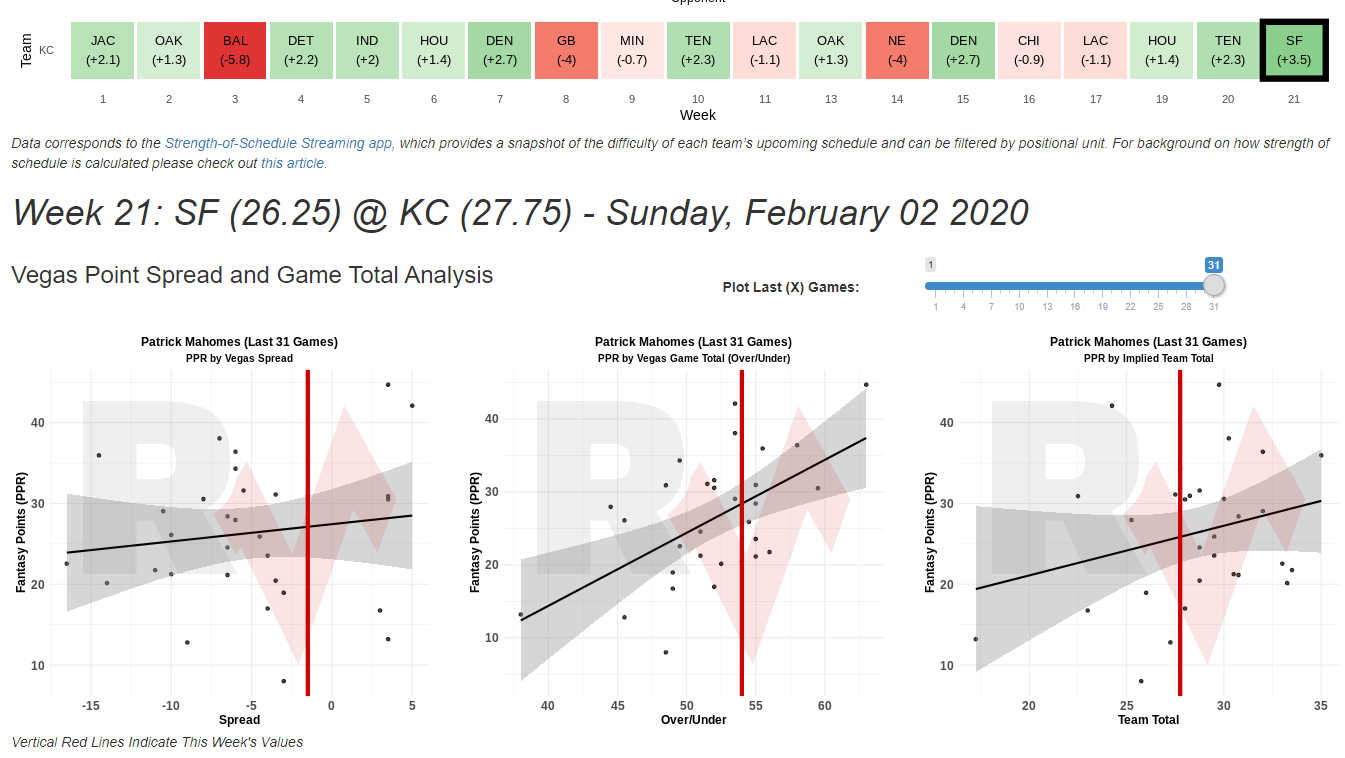
Which defense has the most favorable matchup this week? How difficult of an upcoming schedule do San Francisco’s WRs oppose down the stretch? The SOS Streaming App uses an advanced methodology for quantifying schedule strength and answering these questions.

The RotoViz Screener is the best kept secret and arguably most powerful tool in the entire fantasy industry. Use the tool to search for a plethora of stats, summarize a player’s career, build regressions, compare players, and query the RotoViz database with a multitude of filters. If there’s something that you’re curious about, odds are you can learn more about it in the screener!
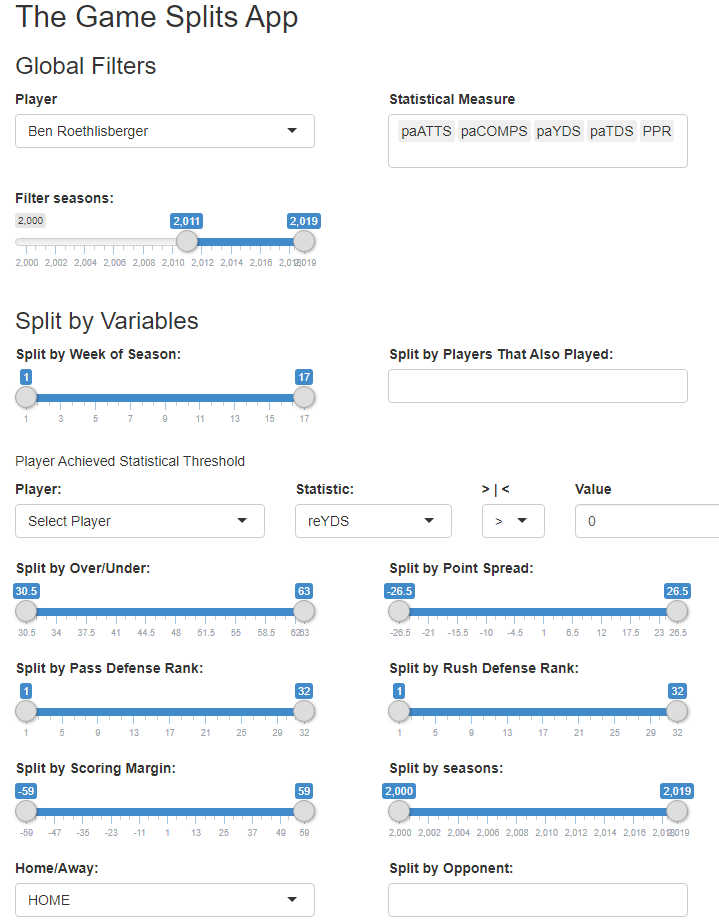
Ever wondered how much better Tom Brady performed when Rob Gronkowski was in New England’s lineup? Does Stefon Diggs score more points when Adam Thielen isn’t playing? Use the Game Splits App to answer these questions.


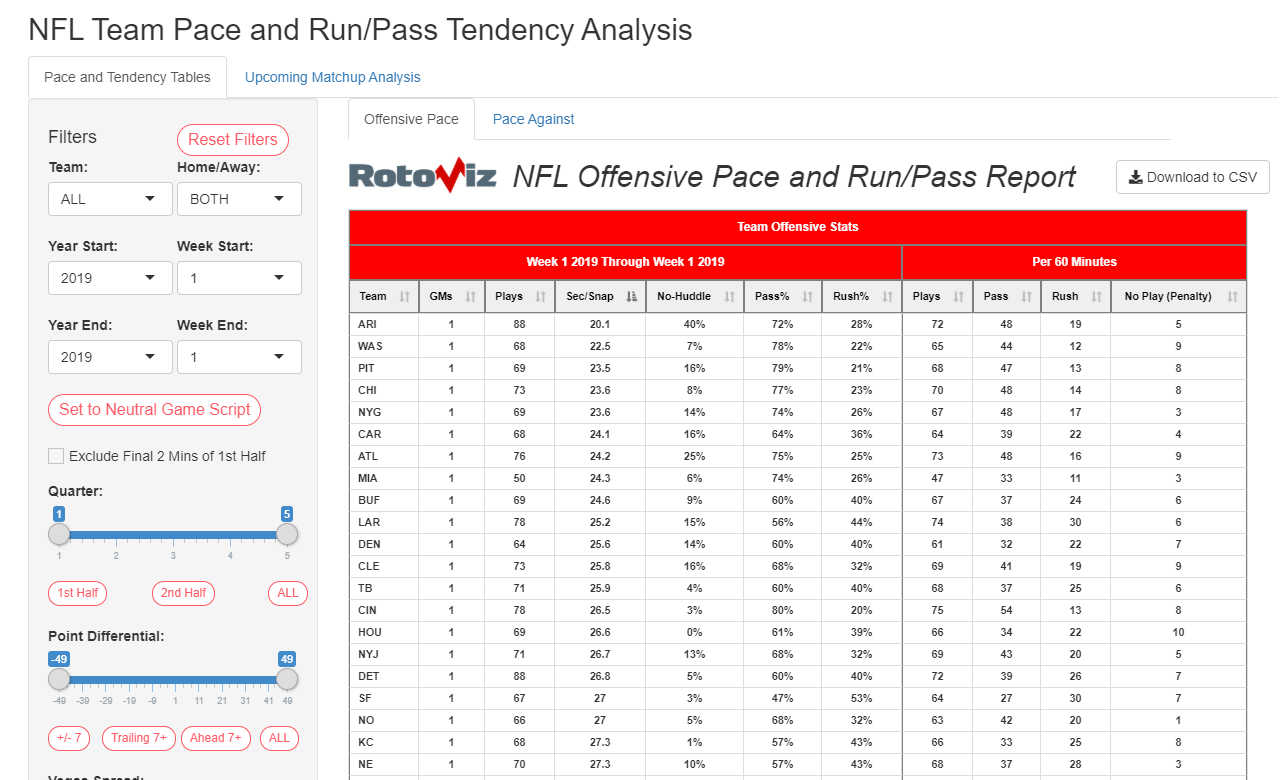
Great DFS players know the important role that game flow and pace play in fantasy point production. The NFL Pace App is their go to resource for identifying team pass/run tendencies, speed of play, and plays per game. Filter for point differentials, home/road splits, a single week or a range.
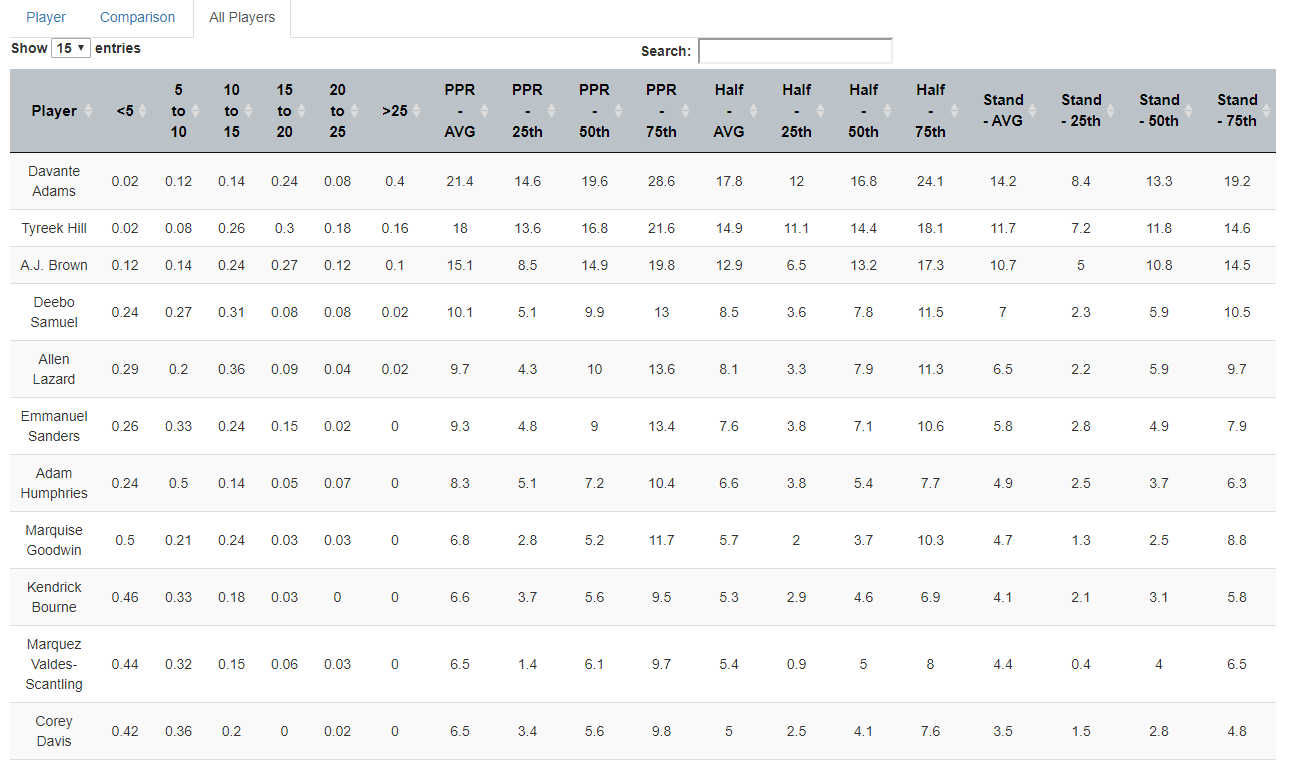
Quickly review weekly leaders in fantasy point scored or look up your favorite players. Filter for year, game range, position, and scoring type.
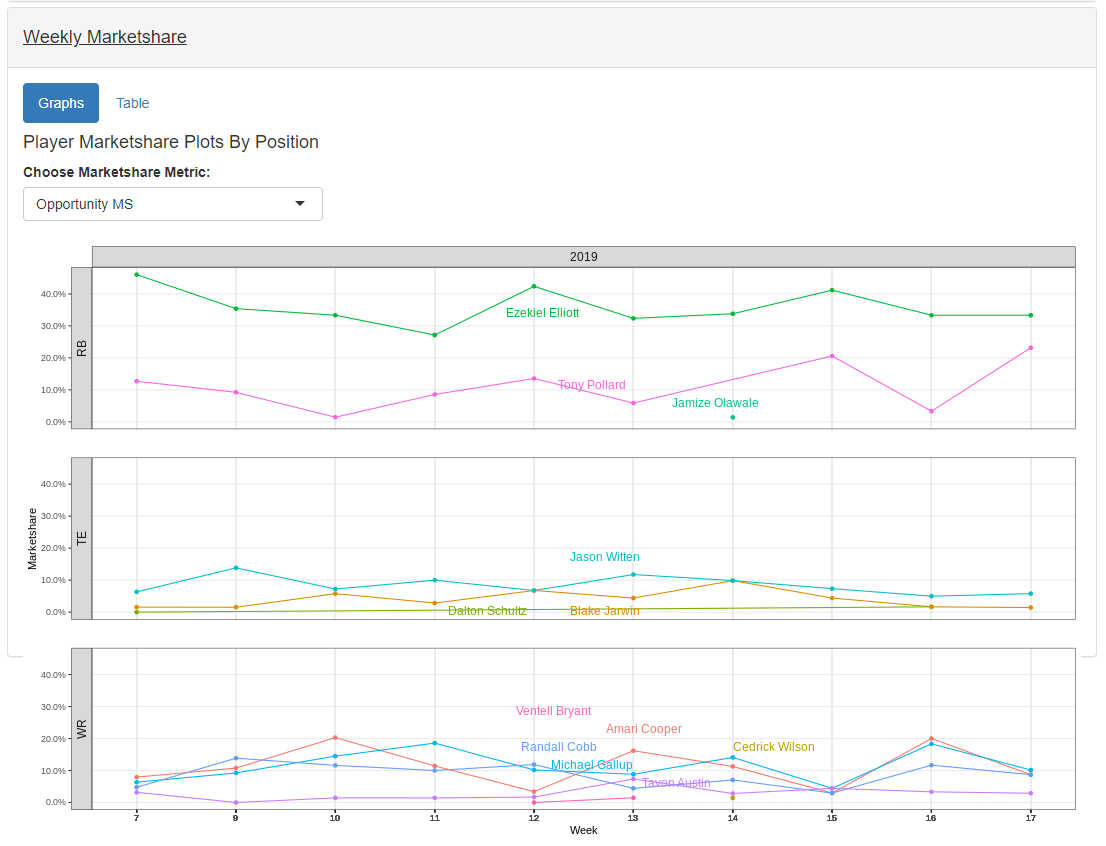
Opportunity is king in fantasy football. As a result, knowing which players control the largest portions of their offenses is vitally important. The Player Usage App will help you spot the next ball hog and be aware of the veterans with decreasing usage.
Track the players that teams are adding and be aware of those that are getting dropped. The tool highlights trends for quick review and is a major asset in managing your team.
The team splits app is useful for determining how a team performs when on the road or at home, is expected to win or an underdog, and when a particular player is active or sidelined.
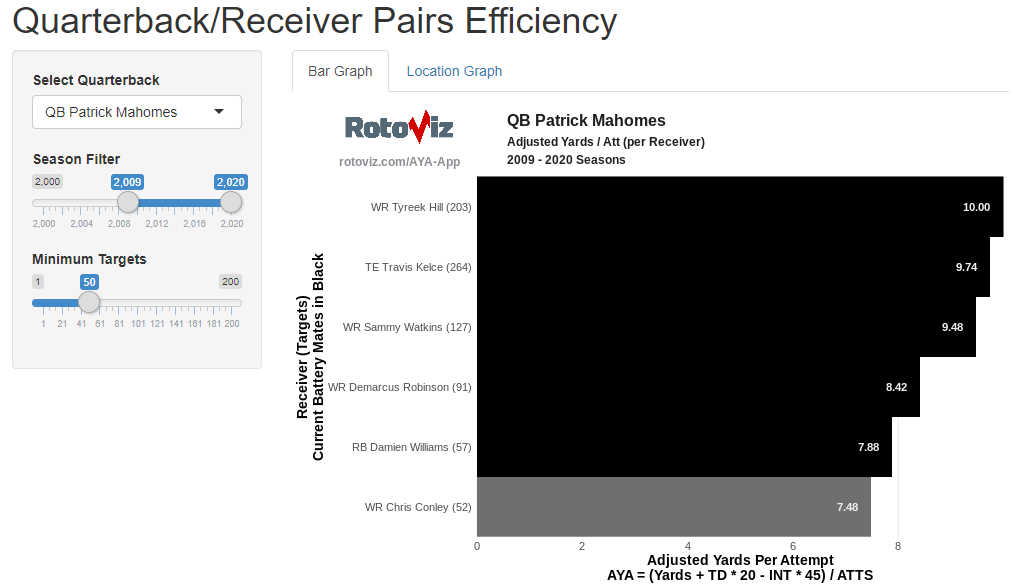
Adjusted yards per attempt is a way to quantify the yards generated per passing attempt while adjusting for the impact of touchdowns and interceptions. The AYA app allows users to select passers, filter for seasons, and determine which receivers they pair most efficiently with.
Building projections is an art and there is a right way and a wrong way to do so. The RotoViz Projection Machine walks you through the entire process, providing all the information you need, to build well thought out and calculated projections for the coming season. While you can surely rely on the projections of our experts, the perspective that you’ll gain and appreciation for the inputs that go into developing fantasy expectations via using the Projection Machine can’t be understated.
The Range of Outcomes App uses RotoViz’s historical projections to provide a range of expectations for player performance in the coming season.
The Win the Flex App uses historical ADP data and points scored to help users better understand when and what positions to attack the flex!
How much does the first running back drafted typically score? How much does the 10th RB drafted typically score? By looking at historical fantasy points scored based on ADP we automatically account for projection error while also taking advantage of the wisdom of crowds. The projections aren’t what you’d expect to see for the top-ranked players at each position, but that’s because they’re aware of how often we get things wrong. These projections don’t assume ADP is a perfect predictor. Rather, they only assume that the future is going to look roughly like the past.
Who are the fist players going off the board, which rookies are rising up, and how has negative news impacted the draft stock of your favorite veterans? stay on top of all ADP trends with the FFPC Redraft ADP App.
How did best ball teams that drafted Tyler Boyd do in 2019? Was drafting RBs with ADPs between 100 and 150 a successful strategy? The Best Ball Win Rates app will help you answer these questions.

Follow along, live, with your FFPC Best Ball Draft, get a sense of which players will be available at your next pick, and track player exposure.
Use the Roster Construction Explorers to identify the most successful roster constructions, know when to target positions and in what amounts, explore win rates, and dominate your Best Ball leagues.
Filter ADP data for specific date ranges, identify trends, and track player shares.