


The RotoViz Team recently released an updated version of our Range of Outcomes App. This tool helps users to better understand a player’s realistic range of outcomes for the coming season. In this article, Dave Caban overviews the process of building the tool and interpreting its results.
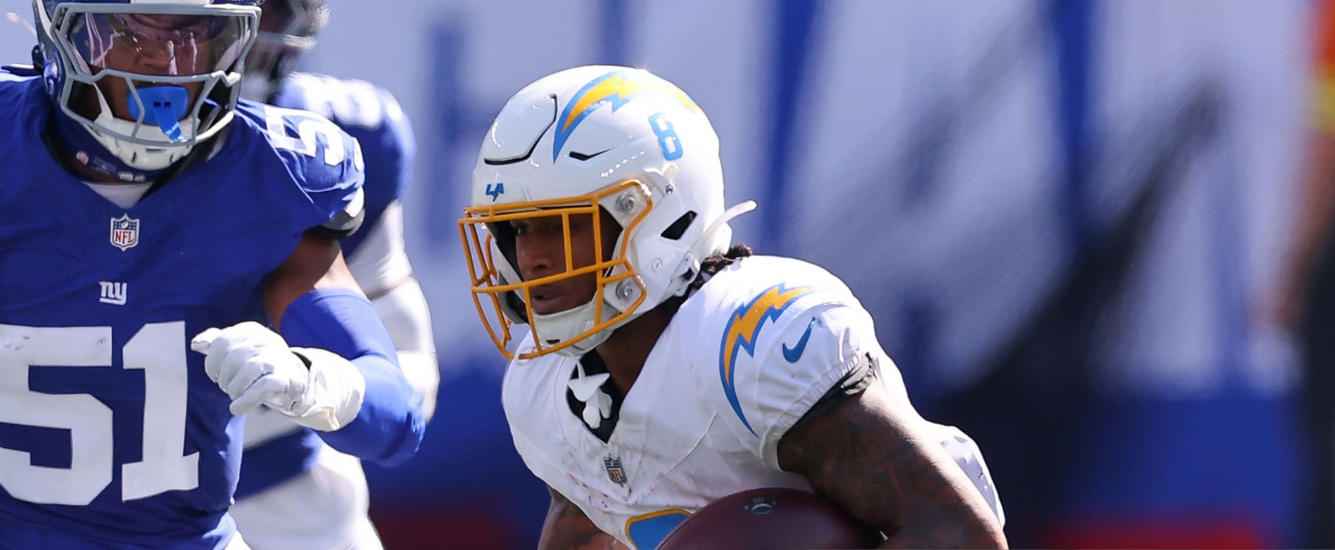
Austin Ekeler was awesome in 2019. He finished as an RB1 in seven weeks and was the RB6 in PPR per game. Interestingly, Ekeler recorded just 132 rushing attempts, and his fantasy success came largely through the air. He turned 108 targets into 92 receptions, 993 yards, and eight touchdowns. Melvin Gordon didn’t play until Week 5 of last season, but Ekeler was solid even when sharing the backfield.

Fast forward to 2020, and Ekeler looks primed to once again be an RB1. Gordon is in Denver and the Chargers didn’t draft a running back until selecting UCLA product Joshua Kelley in Round 4. However, Philip Rivers has departed for Indianapolis and Tyrod Taylor figures to start the season under center. This could change the complexion of Los Angeles’s offense and decrease the number of targets that go Ekeler’s way. These concerns will surely factor into any subjective projections we might build. As a result, before even considering efficiency, it’s easy to see how one could assume that Ekeler’s floor and ceiling are not grouped closely together. Fortunately, there are other ways that we can develop expectations of a player’s range of outcomes. By combining these approaches, our chances of gaining a stronger overall perspective increases.
One way that we can approximate a player’s range of outcomes is by using what the RotoViz Team now calls “Historical Projections.” In the early days of the site, we used “Sim Scores,” which were created using a similar approach. Historical projections review a “searched” player’s statistical output in a given year (year n), find players from prior seasons that produced similarly, and review the output these players produced in the subsequent season (year n+1). This output can be used to develop estimates for the “searched” player’s upcoming season.
For the 2020 season, I made an important tweak to the app. For veteran players, it now looks back two seasons to find “matching players.” Greater emphasis is placed on the most recent season. This helps to smooth things out and prevent outlier seasons from clouding the calculated range of outcomes.
Using Historical Data to Estimate the Future
Overall, the process of building historically based ranges of outcomes is fairly straightforward. However, there are a couple of steps that need to be taken before we can look at individual players. These steps are performed on a positional basis and inform the math that the app uses when searching for matches.
- Identify position-specific statistics that are correlated year over year.
- Identify position-specific statistics that are correlated with fantasy points.
- Determine position-specific statistics that are correlated year over year and are also correlated with fantasy points.
- For example, targets are a major component of wide receiver scoring and correlate strongly year over year. As a result, targets are an included statistic for WRs.
- Weight the statistics determined in 3, in a way that best predicts subsequent year outcomes.
- As you’d expect, targets are one of the most heavily weighted WR statistics.
Some statistics that fit the above criteria, despite weaker correlations, do get included in the app, but carry little weight. Experience, considered as seasons played, is also used in the math.
The Search and The Match
With our position-specific statistics identified and weightings assigned, we’re ready to search for individual players. Let’s consider Ekeler’s output from 2019.
| Player | EXP | ruAtt | ruYards | ruTD | Targets | Recs | reYards | PPR | Half | Stand |
|---|---|---|---|---|---|---|---|---|---|---|
| Austin Ekeler | 3 | 8 | 35 | 0.2 | 6.8 | 5.8 | 62 | 19.3 | 16.4 | 13.6 |
Note that within the app, certain variables used when searching for “matching” players may not be included in the “2019 Per Game Stat Line” section.
When Ekeler is selected, the app finds Ekeler’s 2019 and 2018 output for the relevant statistics. It then compares the absolute difference between Ekeler’s statistics and those of every RB in its database, by looking at year n and year n-1 groupings. These differences are then multiplied by the determined weightings, and the players with the smallest weighted differences will be considered Ekeler’s best matches. As you’d expect, the year n output produced by these players is very similar to Ekeler’s. Remember, the app is also looking at Ekeler’s 2018 results and those of the season prior to those included for each player below.[1]
| Rank | Year | Matches | EXP | ruAtt | ruYards | ruTD | Targets | reYards | PPR | Half PPR | Stand |
|---|---|---|---|---|---|---|---|---|---|---|---|
| 1 | 2008 | Reggie Bush | 3 | 10.6 | 40 | 0.2 | 7.3 | 44 | 18.6 | 16 | 13.4 |
| 2 | 2015 | Dion Lewis | 3 | 7 | 33 | 0.29 | 7.1 | 55 | 17.2 | 14.6 | 12 |
| 3 | 2015 | Arian Foster | 7 | 15.8 | 41 | 0.25 | 7 | 57 | 19.3 | 16.5 | 13.8 |
| 4 | 2005 | Brian Westbrook | 4 | 13 | 51 | 0.25 | 8 | 51 | 19 | 16.5 | 13.9 |
| 5 | 2004 | Brian Westbrook | 3 | 13.6 | 62 | 0.23 | 6.7 | 54 | 21.3 | 18.5 | 15.7 |
| 6 | 2017 | Chris Thompson | 5 | 6.4 | 29 | 0.2 | 5.4 | 51 | 15.3 | 13.4 | 11.4 |
| 7 | 2001 | Warrick Dunn | 2 | 12.2 | 34 | 0.23 | 7.5 | 43 | 15.4 | 12.8 | 10.2 |
| 8 | 2002 | Charlie Garner | 3 | 11.4 | 60 | 0.44 | 6.9 | 59 | 21.7 | 18.9 | 16 |
| 9 | 2002 | Jamel White | 3 | 7.6 | 34 | 0.21 | 6.1 | 32 | 12.4 | 10.1 | 7.9 |
| 10 | 2001 | Duce Staley | 2 | 12.8 | 46 | 0.15 | 7 | 48 | 16 | 13.6 | 11.2 |
| 11 | 2014 | Ahmad Bradshaw | 8 | 9 | 43 | 0.2 | 4.7 | 30 | 15.5 | 13.6 | 11.7 |
| 12 | 2011 | Darren Sproles | 6 | 5.4 | 38 | 0.13 | 7 | 44 | 17.3 | 14.6 | 12 |
| 13 | 2018 | Tarik Cohen | 2 | 6.2 | 28 | 0.19 | 5.6 | 45 | 14.6 | 12.4 | 10.2 |
| 14 | 2016 | Giovani Bernard | 4 | 9.1 | 34 | 0.2 | 5.1 | 34 | 12.2 | 10.3 | 8.3 |
| 15 | 2006 | Kevin Jones | 3 | 15.1 | 57 | 0.5 | 6.5 | 43 | 18.3 | 15.8 | 13.2 |
| 16 | 2018 | James White | 5 | 5.9 | 27 | 0.31 | 7.7 | 47 | 17.3 | 14.6 | 11.9 |
| 17 | 2003 | Moe Williams | 4 | 10.9 | 47 | 0.31 | 5.3 | 40 | 15.2 | 13.2 | 11.2 |
| 18 | 2013 | Shane Vereen | 3 | 5.5 | 26 | 0.13 | 8.6 | 53 | 16.8 | 13.9 | 10.9 |
| 19 | 2011 | Matt Forte | 4 | 16.9 | 83 | 0.25 | 6.3 | 41 | 18.4 | 16.2 | 14.1 |
| 20 | 2018 | Kenyan Drake | 3 | 7.5 | 33 | 0.25 | 4.6 | 30 | 12.5 | 10.9 | 9.2 |
The Subsequent Season and Searched Player Year N+1 Estimates
By reviewing the results of each matches’ year n+1 we can begin to estimate Ekeler’s 2020 production.
Footnotes
| ↑1 | Note that the below list is truncated as the app gathers each player’s 50 closest matches. |
|---|


