



The RotoViz staff shows off the wide array of tools and in-depth analysis the site offers fantasy managers so they can dominate redraft, best ball, and dynasty leagues in 2026.
Now that we find ourselves in the thick of draft season, it’s time to lock in and prepare for another year of fantasy glory!
Some of us sickos have been drafting in best ball tournaments since January, and dynasty is truly the fantasy format that never sleeps. Still, the vast majority of fantasy players are just now starting to dive into the 2026 NFL season.
Whether you’re 500 best ball teams deep or just beginning to prep for your lone home league, we’ve got all the tools and content you need to make 2026 a fantasy season to remember.
One of our recent major rollouts was Dave Caban’s update to the Range of Outcomes tool:
Range of Outcomes Tool — Quick Summary
The RotoViz Range of Outcomes tool uses historical data to help users better understand a player’s realistic range of outcomes for the coming season. The tool reviews a player’s statistics from his two most recent seasons to match him with players from prior seasons who produced similar statistics. By looking at how those players performed in their following season, the tool builds a reasonable expectation of what the searched player’s upcoming season might look like.
There are two important caveats. First, the tool has no awareness of team or roster changes, injuries, or anything that lives outside of historical statistics. Second, because it’s built on historical data, it doesn’t include rookies. (That said, I’m working on a Rookie ROO that will leverage collegiate production and draft position to perform a similar exercise.)
Range of Outcomes Tool — A Walk Through the Logic
The idea behind the tool is simple, and we can use Bijan Robinson as an example to walk through the full process. Robinson, of course, is a running back, but we run a similar process for every position.
Heading into the 2026 season, how do we get our heads around the range of possibilities for Robinson? We could look at his fantasy production from last season and apply some multiplier based on how we feel about his prospects. We could simply carry his 2025 fantasy scoring forward. We could build a team-level projection: figure out how many plays the Falcons will run, what share of the carries we expect Robinson to get, allocate a percentage of targets to him, predict his efficiency, and put together a typical fantasy projection.
Each of those approaches has real limitations. None of them tell you the different ways his season could actually play out. If Robinson strikes gold, what does that look like? If he has a modest season for a superstar back, what does that look like? For an elite player like Robinson, this might be a more straightforward exercise than for a less proven player like Bhayshul Tuten. Regardless of the specific player, there’s real value in understanding what a realistic range of outcomes for the year ahead looks like, as opposed to the single number a typical projection collapses everything down to.
One could push back and recommend creating a low, mid, and high projection. I’d argue that having a realistic range of expectations actually gives you a better understanding of a player’s upside than simply landing on a high-end projection. This is because the ROO exercise lets us build a full distribution and see where it’s concentrated. This allows us to see what percentage of outcomes sit toward a player’s ceiling or where the bulk of his distribution actually lives. Keep that in mind as we continue.
How Do We Build This Distribution?
We start by looking at the running back stats that carry over consistently from year to year. We deliberately avoid stats that are prone to big swings or spikes that aren’t reliable for projecting forward. From there, we determine how important each remaining stat is for predicting fantasy scoring. We then run a redundancy check to make sure we don’t retain variables measuring the same thing.
Using that and some nerdy math, we calculate the best blend of a player’s last two seasons to build his profile. For this exercise, we can think of a profile as the numbers the matching engine will use in its search. For Robinson, that blended profile looks something like this:
Experience is factored into the tool’s searching mechanism to match players with others at similar points in their career. (This does sometimes get tricky for veterans who have been in the league a long time. Matthew Stafford, for example, has played 17 seasons. There are only a handful of other passers that remained relevant for that long, so the tool can’t provide a list of comps in a similar experience range.) You may wonder if fantasy scoring factors into the tool’s search. It would make sense that you’d want to match a player with others that scored similarly, right? While that might seem intuitive, the answer is we don’t, and there are two major reasons. First, we don’t need to. Fantasy scoring is largely just an output of the stat lines we’re already looking at. Adding points on top of that wouldn’t tell the matching engine anything it doesn’t already know; it would be redundant. Second, since fantasy points are the very thing we’re trying to understand, it’s best to leave them out of the discovery process entirely. If we matched players by how many points they scored, we’d be assuming the very outcome we’re supposed to be testing for. On top of that, two players can land on the same point total in very different ways, and only the underlying box score tells us the difference.
To find the closest matches, we compare Robinson’s blended profile against every other RB season in that pool and look for the ones that are statistically closest to his. Essentially, we’re searching for the seasons that most resemble his in the numbers that matter most for predicting what comes next. We filter out any season, either the matching year or the year after it, where a player appeared in fewer than four games, so a short, injury-shortened stretch doesn’t distort a match. From there, taking the 50 closest comps works well for the exercise.
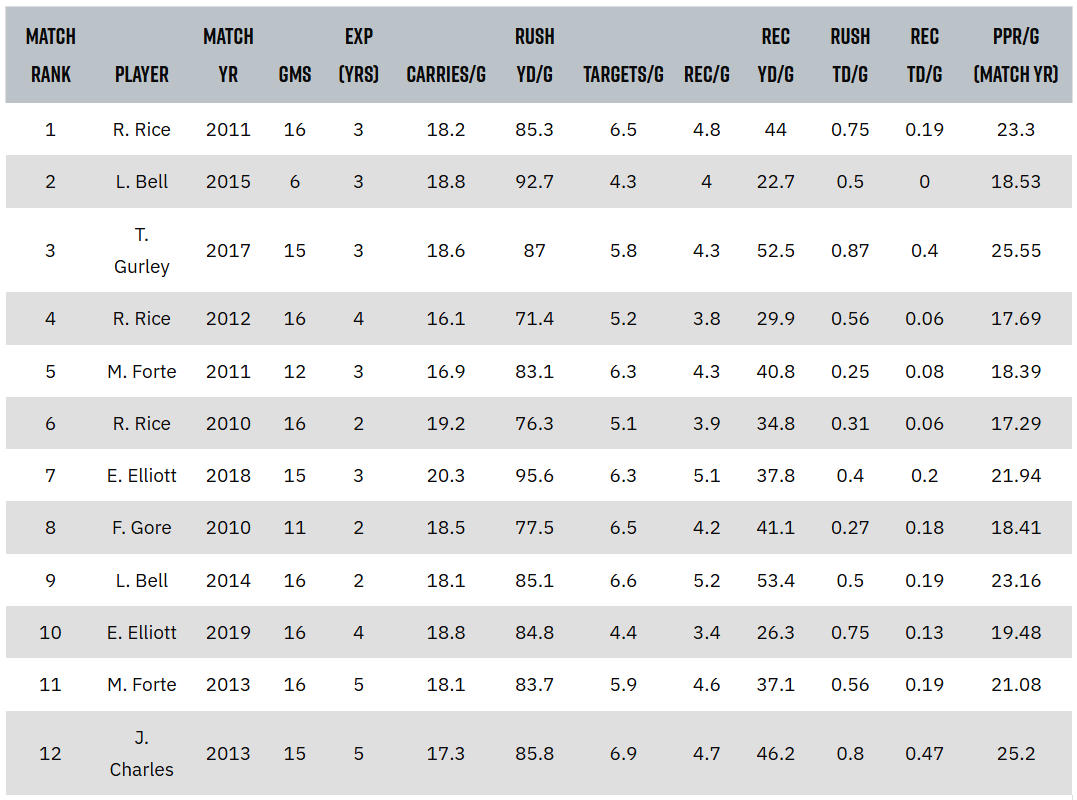
Below are Robinson’s 12 closest matches. You can check out the tool for the complete listing.
This tracks with what you’d expect, as Robinson’s comp group is full of star backs early in their careers that tended to contribute as rushers and receivers.
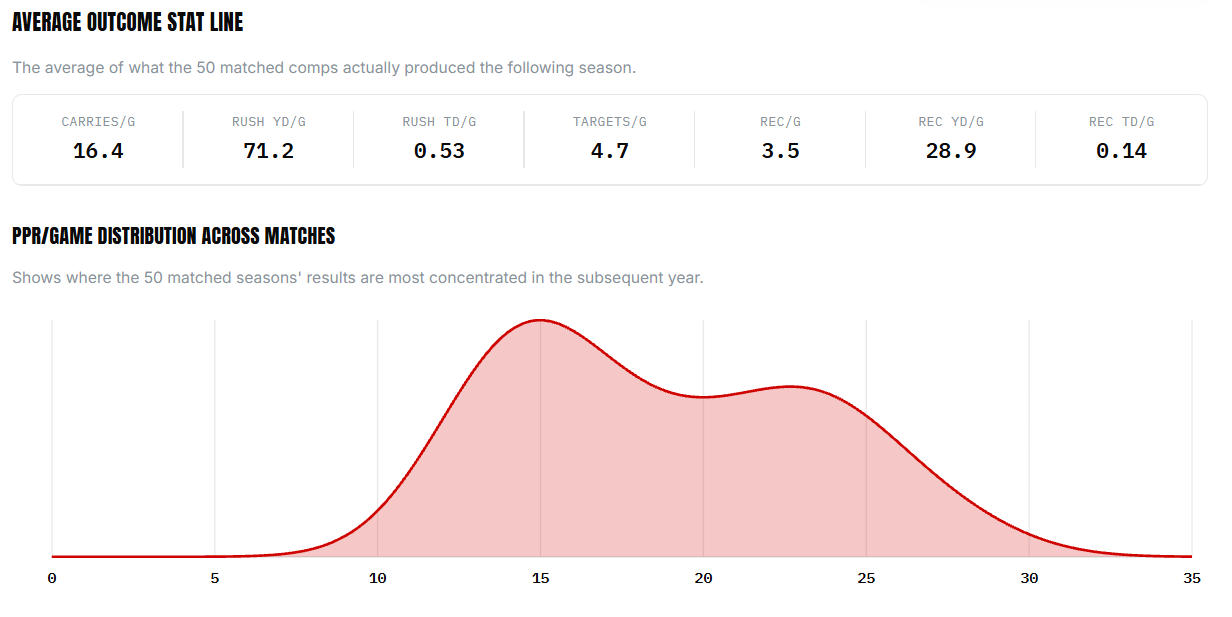
Next, we look at what each of those matched players did in the following season. We call this the N+1 season. That’s what actually builds our sense of what 2026 could look like, and it’s a lot more useful than a single projected number. Turning those 50 N+1 outcomes into a density plot tells us a great deal. For example, where the distribution is concentrated, how much of it sits toward the high end, and what a truly average outcome for this specific comp group actually looked like in real box scores. This provides a second, grounded way to sanity-check the ROO projection beyond a singular PPR number.

Range of Outcomes: 2026 Updates and the Tool That Brought Me Out of “Retirement”
Another groundbreaking article to recently be published on the site was Shawn Siegele’s deep dive into NFL injury trends, as well as the relationship between real-world draft capital, fantasy ADP, and rookie-year production:
RB Golden Age and The Injury Project
To truly understand the RB/WR dynamic, we need to understand player health. The injury landscape and its ramifications also go far beyond this narrow question. With injury-related questions that were more granular than I would have time to research on my own, I made it a project for Anthropic’s Fable 5.
In working through this endeavor, it’s important to be up front about weaknesses. AI as a research tool has at least four obvious problems: factual errors, telling you what they think you want to hear, drawing conclusions that mirror the mistakes of human analysts, and defaulting to the internet’s conventional wisdom instead of rigorously interrogating the data. Any of those issues is a meaningful problem on its own, much less all four. These concerns seemed to be less of an issue for Fable than for Sonnet or Opus (Claude’s lesser, non-Fable options), but it may simply be better at hiding its quirks.
Understanding Injuries
A year ago, in an AMA that Ben and I did for Stealing Bananas, I was asked whether injuries were the final frontier for polishing draft tactics. I liked the question at the time, and it’s certainly stuck with me throughout a 2025 campaign that was almost too good to be true . . . except for the injury results.
So getting at the injury question was really the impetus for this project. Here is what Fable did:
Source: nflverse weekly player stats and official injury reports, 2009-25 regular season (79,085 player-games, 4,679 injury events across QB/RB/WR/TE). Workload defined per position: QB = pass attempts + sacks + rushes; RB = carries + targets; WR/TE = targets + carries. Outcome measured: missed next game (Out/Doubtful report or unexplained absence). Model: logistic regression on trailing 4-game workload (z-scored, quadratic term) plus a season trend term, fit separately by position.
While we’ve historically used Sports Info Solutions for our advanced stats tools and for special projects like the RotoViz Rookie Guide, nflverse is the service that has fueled tools like the NFL Player Stat Explorer.
For overall injuries, the highest level takeaway was somewhat straightforward and intuitive.
All four positions cluster in a 6-8% per-game injury-next-week band. No position is dramatically safer or riskier in absolute terms — the differences that matter are in the shape of the workload curve and the trend over time, not the baseline.
But what we really want to know, at least as it determines our structural position in drafts, is how injuries work for the most valuable cohort of players. This is where the trends have historically shifted in favor of WRs.
Workload volume genuinely amplifies risk only at RB — rate rises from about 6.0% at 7 touches to 8.3% at 22 touches. For QB, WR, and TE, higher trailing volume does not show a comparable positive risk slope. QB rushing volume specifically showed no significant per-game risk effect.
The increasing injury risk to RBs that comes from a higher workload has been part of the zeitgeist for over a decade, and the consequences for elite backs have been part of the foundations for Zero RB. The surprising and actionable development comes in how this trend is changing.
RB and WR safety flips.
In the pooled 2009–2025 bins WRs averaging 9–12 targets sit at 6.5% per game versus 7.5–7.9% for RBs in the 15–25 touch range. But split it by era and the WR advantage turns out to be an artifact of the older data. In 2009–2016, high-target WRs were dramatically safer (5.4% at 9–12 targets vs 8.0% for 20+ touch RBs). In 2017–2025 they’re essentially tied — WR 9–12 targets at 7.7%, RB 20–25 touches at 7.8%. And with the model anchored to 2023–25 levels, it inverts: a WR1 at 9 targets projects at ~7.1% per game while a bell-cow RB at 18–22 touches projects at ~6.3–6.5%.
That inversion is the same structural divergence from the report’s thesis — RB per-game risk at multi-decade lows, WR risk at highs — showing up inside the workload curves rather than just the position averages.
And beyond the per-game risks, RBs are no longer suffering injuries that keep them out longer.
Conditional on an injury event in the recent era (2017+), a WR1 (9–12 targets) misses 4+ games only 10% of the time and a bell-cow RB (15–25 touches) 11%. Mean absence for both elite groups is ~1.9 games. Notably, the bell-cow tail used to be fatter (17% all-era) — the “bell-cows break catastrophically” pattern has faded alongside the broader RB decline.
Over the last several years, RBs are suddenly not getting hurt as often, and, just as importantly, they’re not suffering injuries of the same duration. It’s not difficult to see how these dynamics cut sharply against Zero RB.
One key, interesting note: Although Fable stated early that the injury dynamics were showing up inside the workload curves rather than just the averages, it did start to tell me a story across the later parts of the project that included workload management as a recent mechanism for RB injury reduction. So I asked it to explicitly evaluate that claim.
RB per-game injury rates fell from 7.20% (2009–16) to 5.79% (2024–25), a 1.4 percentage point (pp) decline. Holding the early-era risk curve fixed and applying it to the modern carry distribution — the pure “management” counterfactual — explains +0.03 percentage points. Two percent of the decline. The player-week carry mix barely moved: mean trailing carries 9.0 → 8.8, share at 15+ carries 22% → 20%. The other 98% is within-workload: injury rates fell at every fixed carry level, and fell most exactly where the exposure is heaviest — 15–20 carry weeks dropped from 7.83% to 5.18% (a 34% decline), 20–30 from 6.96% to 5.26%. Age composition contributes nothing (mean age 25.9 → 25.8). Carrying the ball 18 times in 2025 is simply about a third less likely to cost you next week than the identical workload was in 2014.
Although we have numerous reasons to believe that carrying the ball has gotten safer — dangerous tackling techniques have been curtailed — it’s still a bit difficult to believe that a couple of low-injury seasons have completely changed the calculus. However, that might be understating where we are. The 2025 data file was originally corrupted, and Fable wrote a similar version of this report prior to getting a look at that information. Once the 2025 numbers were cleaned up and included, it felt vindicated.
2025 turned out to strengthen the thesis rather than change it. RB injury rates fell to 5.2%, the lowest of all 17 seasons, while WR hit 8.0%, the highest — the structural divergence the report argues for. QB held steady at 6.4%, confirming the 2021–22 spike was mostly noise.
So if you’re wondering whether the 2025 season was as good for RBs and as bad for WRs as it felt, the answer to both is a resounding yes.
My guess for the underlying mechanism here: I believe the stark decrease in RB injuries over the last two years is both structural and fluky. We know that some years are going to be good and some bad for RB health, and when you layer a good year on top of a structural change, you get what we saw in 2025. Specifically on the WR side, it’s difficult to believe that playing the position is getting riskier within an environment where the NFL has made some changes to address the injury context. One element worth considering: injury profiles are real, and the composition of the RB and WR positions may currently favor RBs.
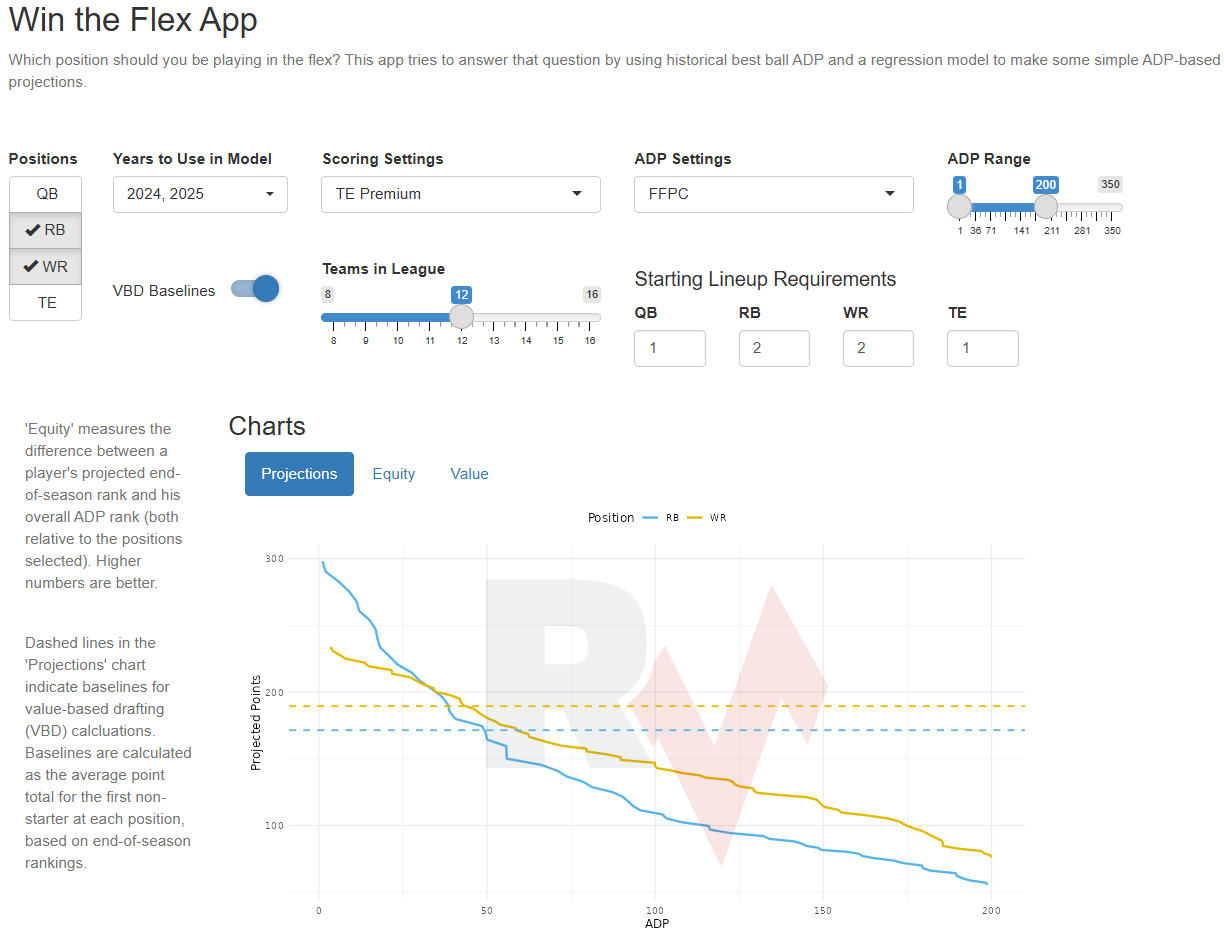
Another tool that can help drafters with their macro-level strategies is the Win the Flex app (WTF). Late in July, I wanted to see what insights the tool could provide us with for the 2026 season. Although my series focused on single-quarterback leagues where QBs were not eligible for the flex, the WTF still offered some valuable takeaways for the position:
The Win the Flex App (WTF) allows us to look at roster building based on overall scoring via projections based on historical ADP and positional production. Here is how Blair explained it when the tool debuted in 2019:
The basic idea behind the tool is to get a sense of how many fantasy points we should expect a player to score based purely on positional ADP. How much does the first running back drafted typically score? How much does the 10th RB drafted typically score? By looking at historical fantasy points scored based on ADP we automatically account for projection error while also taking advantage of the wisdom of crowds. The projections aren’t what you’d expect to see for the top-ranked players at each position, but that’s because they’re aware of how often we get things wrong. These projections don’t assume ADP is a perfect predictor. Rather, they only assume that the future is going to look roughly like the past.
With the WTF, we can compare the projected scoring of all four positions against one another, or we can examine each individual position against their first non-starter baseline.
Although quarterbacks are not eligible for the flex in single-QB formats, the WTF still has a wealth of actionable information for the position. By analyzing the equity and value over baseline of QBs compared to other positions across drafts, we have a better chance of identifying the pockets when investing in signal callers is the most appealing.
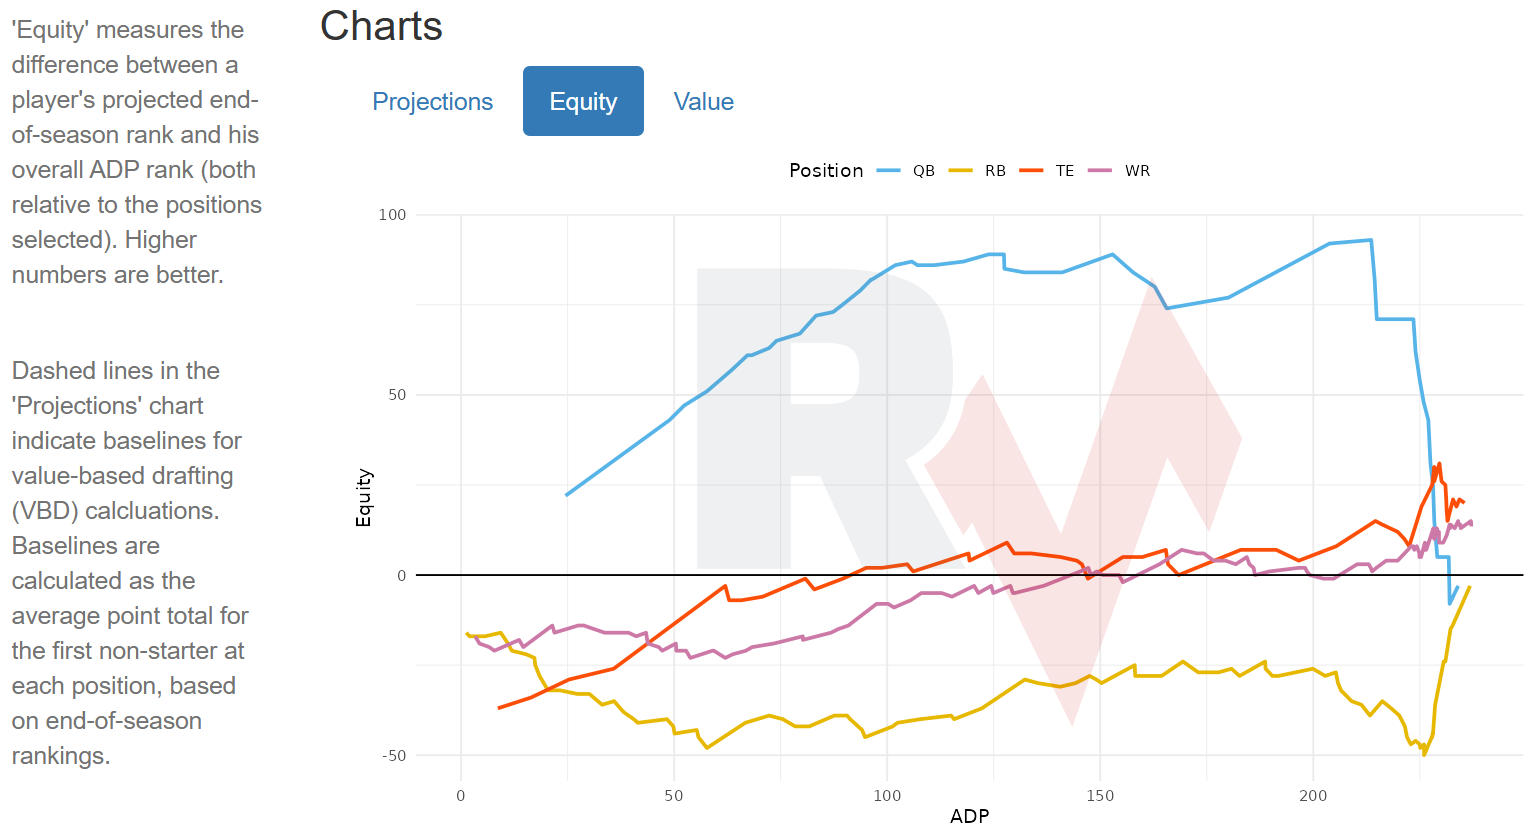
Later in that article, I pinpointed the range where QBs offered the highest equity compared to the other three positions:
The best way to find out where we should be targeting QBs is to find the areas of drafts where they have the largest advantage in equity over the other three positions.
2021-2025
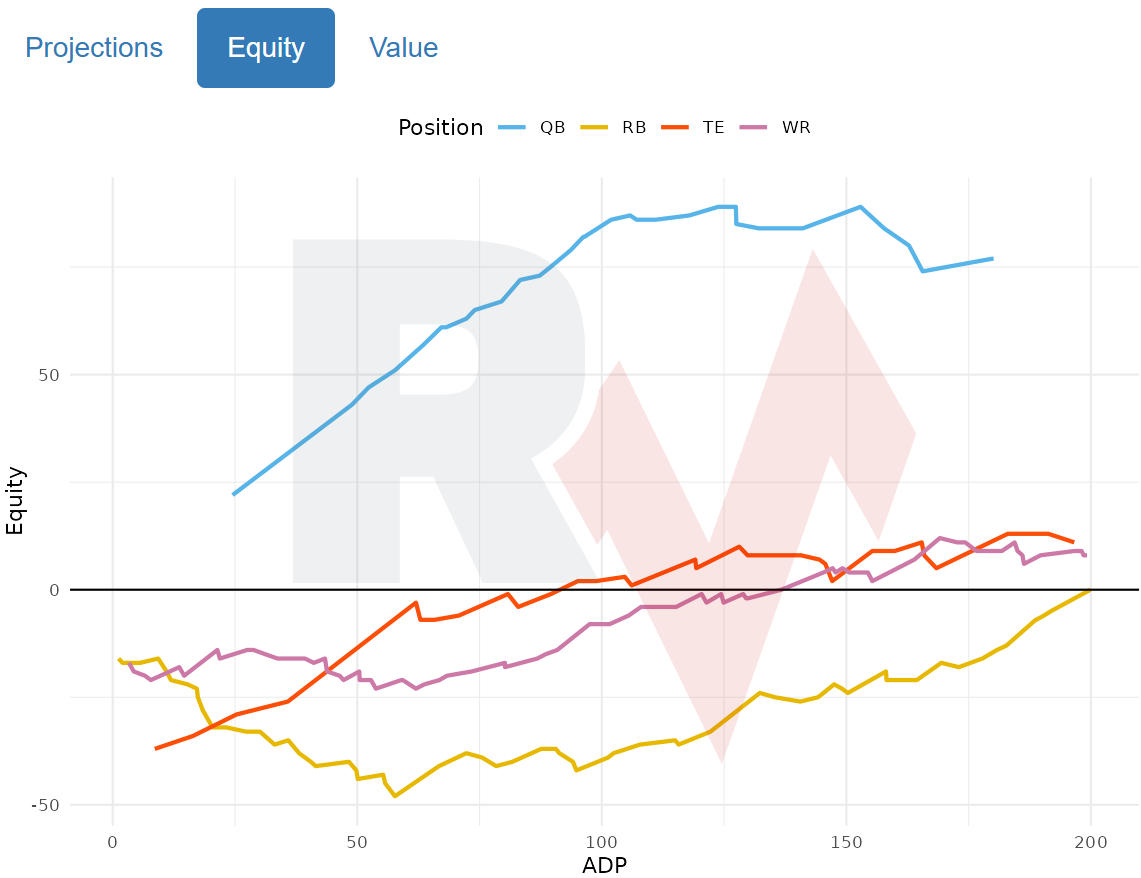
One place that appears to be a prime spot to pick up value is right as TEs overtake WRs in equity. In the current landscape, this occurs around the ADPs of Lamar Jackson and Drake Maye, who offer similar upside to Josh Allen at more than a two-round discount.
Understandably, many drafters are not going to want to invest in elite QBs, and only a few will even have the chance to in each draft. Fortunately, there are even larger equity gaps further down the line.
Following a sharp rise, TE equity begins to flatten out close to the 5-6 turn. Around this same time, WRs start to experience a steady climb, which begins to level out around pick 100.
All the while, QBs experience a very consistent growth in equity up until about pick 100. It is here that we first see QB equity begin to clear 80, starting with the QB15 — in this case being Jared Goff — at an ADP of 96.2.
However, we have to get to Kyler Murray at QB 17 (101.9 ADP) before we see QBs begin to hold an 80-point equity advantage over both TEs and WRs. For reference, Lamar Jackson holds a 64-point equity advantage over the closest WR, although he does not have a TE going within a round of his ADP.
2021-2025
We see this advantage largely hold steady — if not grow — until we get to QB28 at the start of the 14th round (Jacoby Brissett).
2021-2025
Based on this information, the rounds that are most advantageous for QB picks compared to the other three positions are from Round 9 to Round 13.

Forget the Flex: What Does the Evolving Quarterback Landscape Mean for Our 2026 Best Ball Teams?
Speaking of winning the flex, we should not assume that the strategy only applies to the offensive side of the ball. This summer, Mat Irby has been on a quest to gain a deeper knowledge of IDP leagues in his Green Dot series, which includes finding the optimal way to fill our defensive flex spots:
Previously on The Green Dot, I started from the . . . well, the start. I am a relative novice to IDP, and I decided to research it live and in person, hoping to share insights into my fantasy football process and teach myself some useful things that will help me expand my skill set, all at once.
COME PLAY WITH US
Also, I’ve picked up eight players to play in a free league with me so far, including RotoViz’s Kevin Szafraniec. I’d love four more (or at the very least, two). If you want to test your skills against at least Kevin and me, don’t hesitate to join. I’m hoping to get a draft going in the next week or two. Just sign up at the link below; first come, first served. Please, I need to field test this work, and I’d love to have you join in my experiment.
PARAPHRASING THE GREEN DOT, VOL. 1
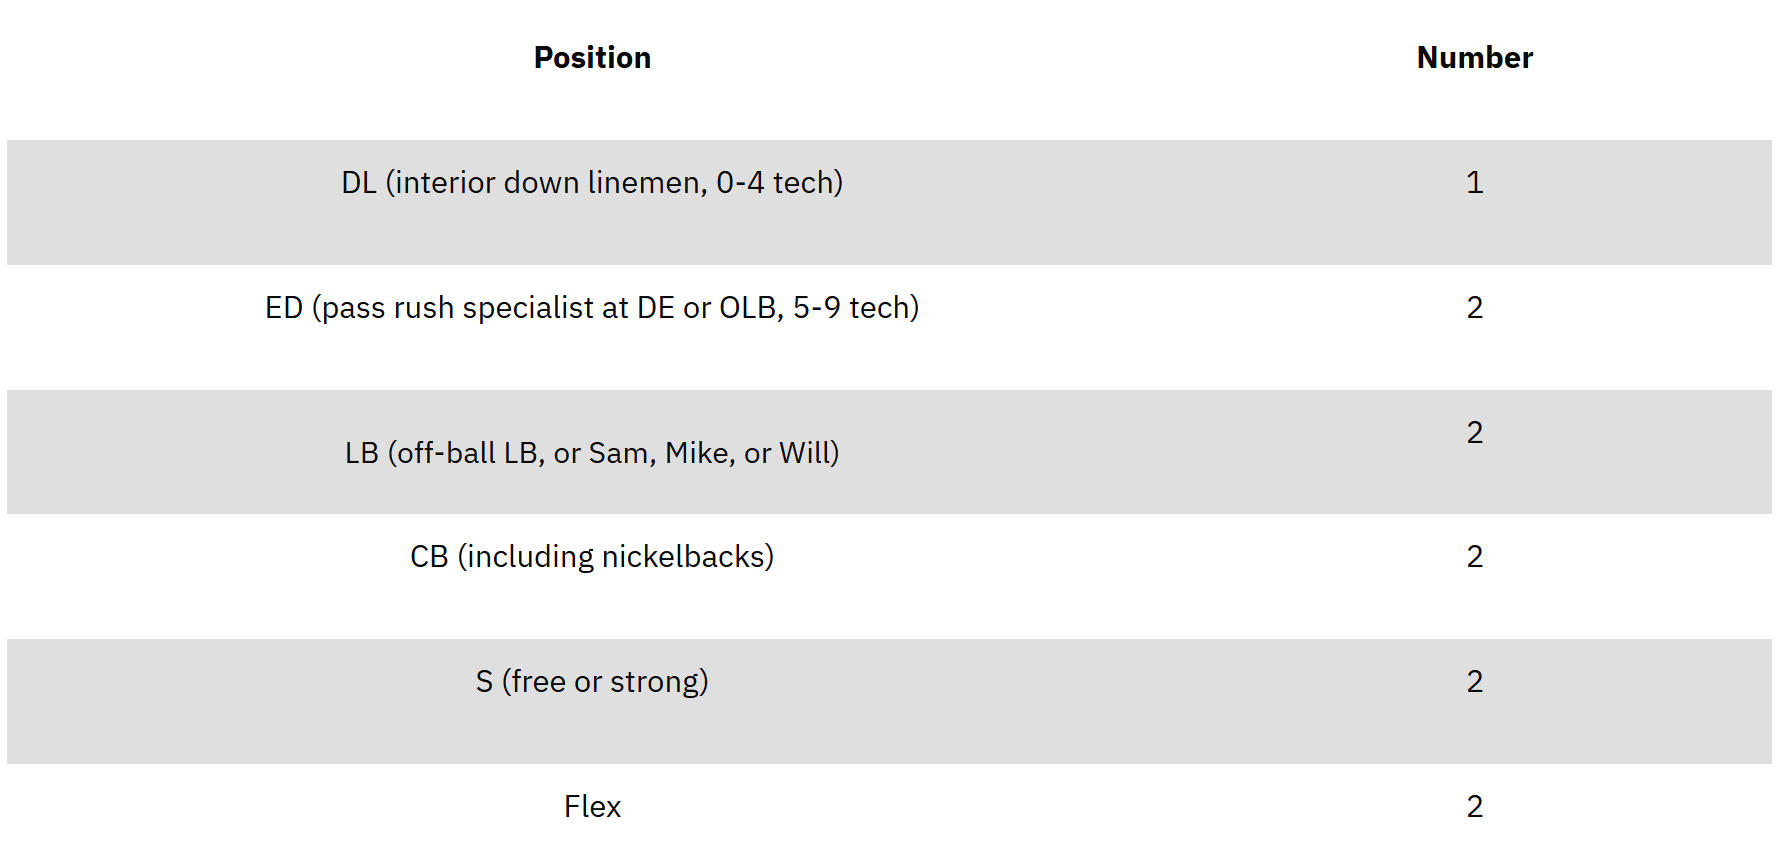
The first thing I did in Volume 1 was set up a framework for a league standard — roster size, positional distribution, scoring system, etc. I went with the Big 3 scoring system and a 1-2-2-2-2-2 format. That means starters at these positions . . .
- 1 DL
- 2 ED (edge)
- 2 LB (off-ball)
- 2 CB
- 2 S
- 2 flexes (any position)
. . . with these scoring parameters:
This is important so that we are all on the same page. It has historically been challenging to research IDP because league formats were so scattered, but some norms are beginning to crystallize as IDP becomes increasingly popular.
The next thing I did was go through the positions, looking at key metrics to see which ones correlate best with Big 3 fantasy scoring.
SOME INITIAL OBSERVATIONS ABOUT IDP SCORING BY POSITION
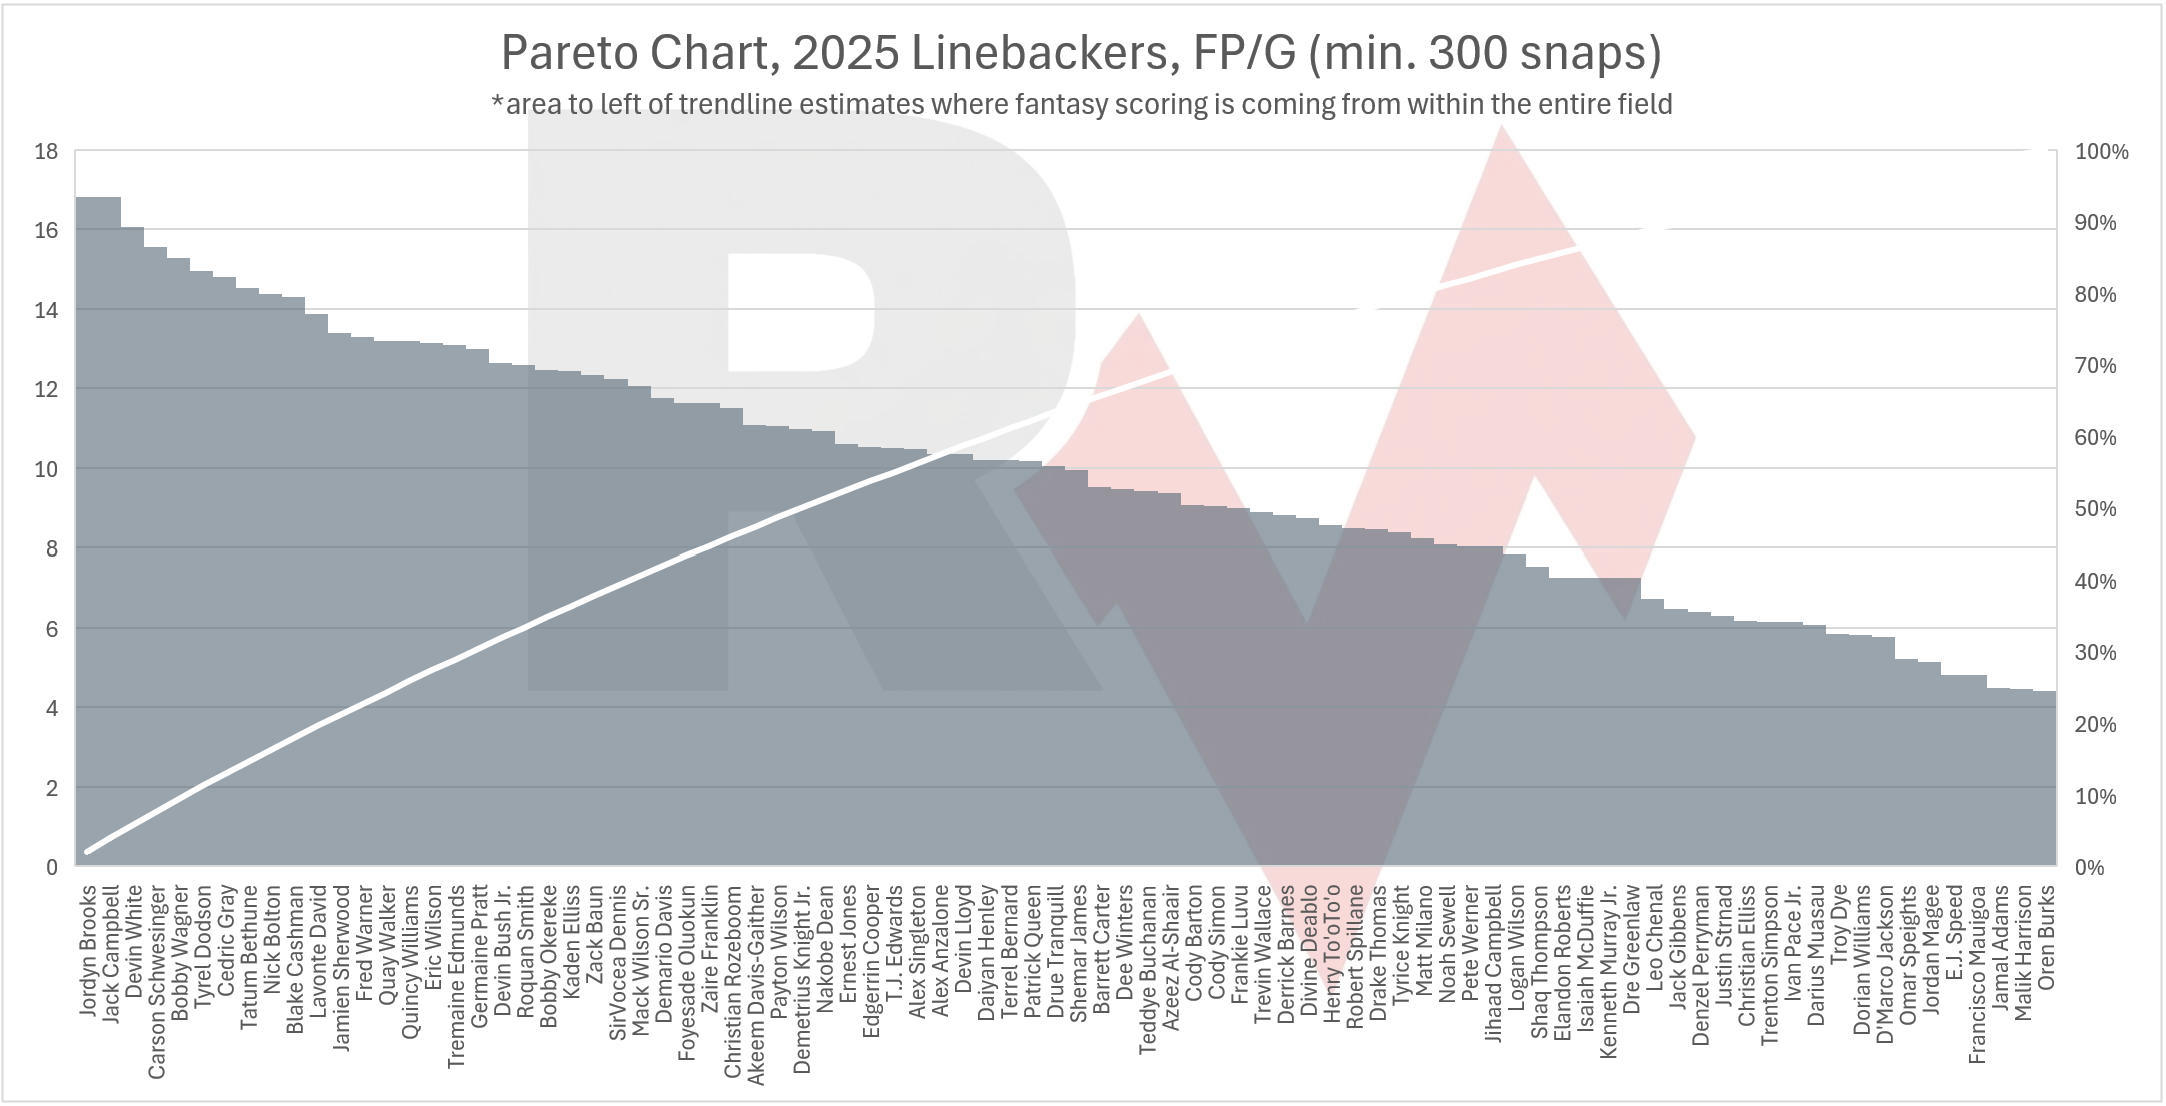
I determined that LBs are unique in that they score a ton of fantasy points, yet their production is so largely opportunity-driven that they almost seem interchangeable. In other words, the individual identity of the LB you start seems to matter less than simply having LBs who are on the field for abundant snaps.
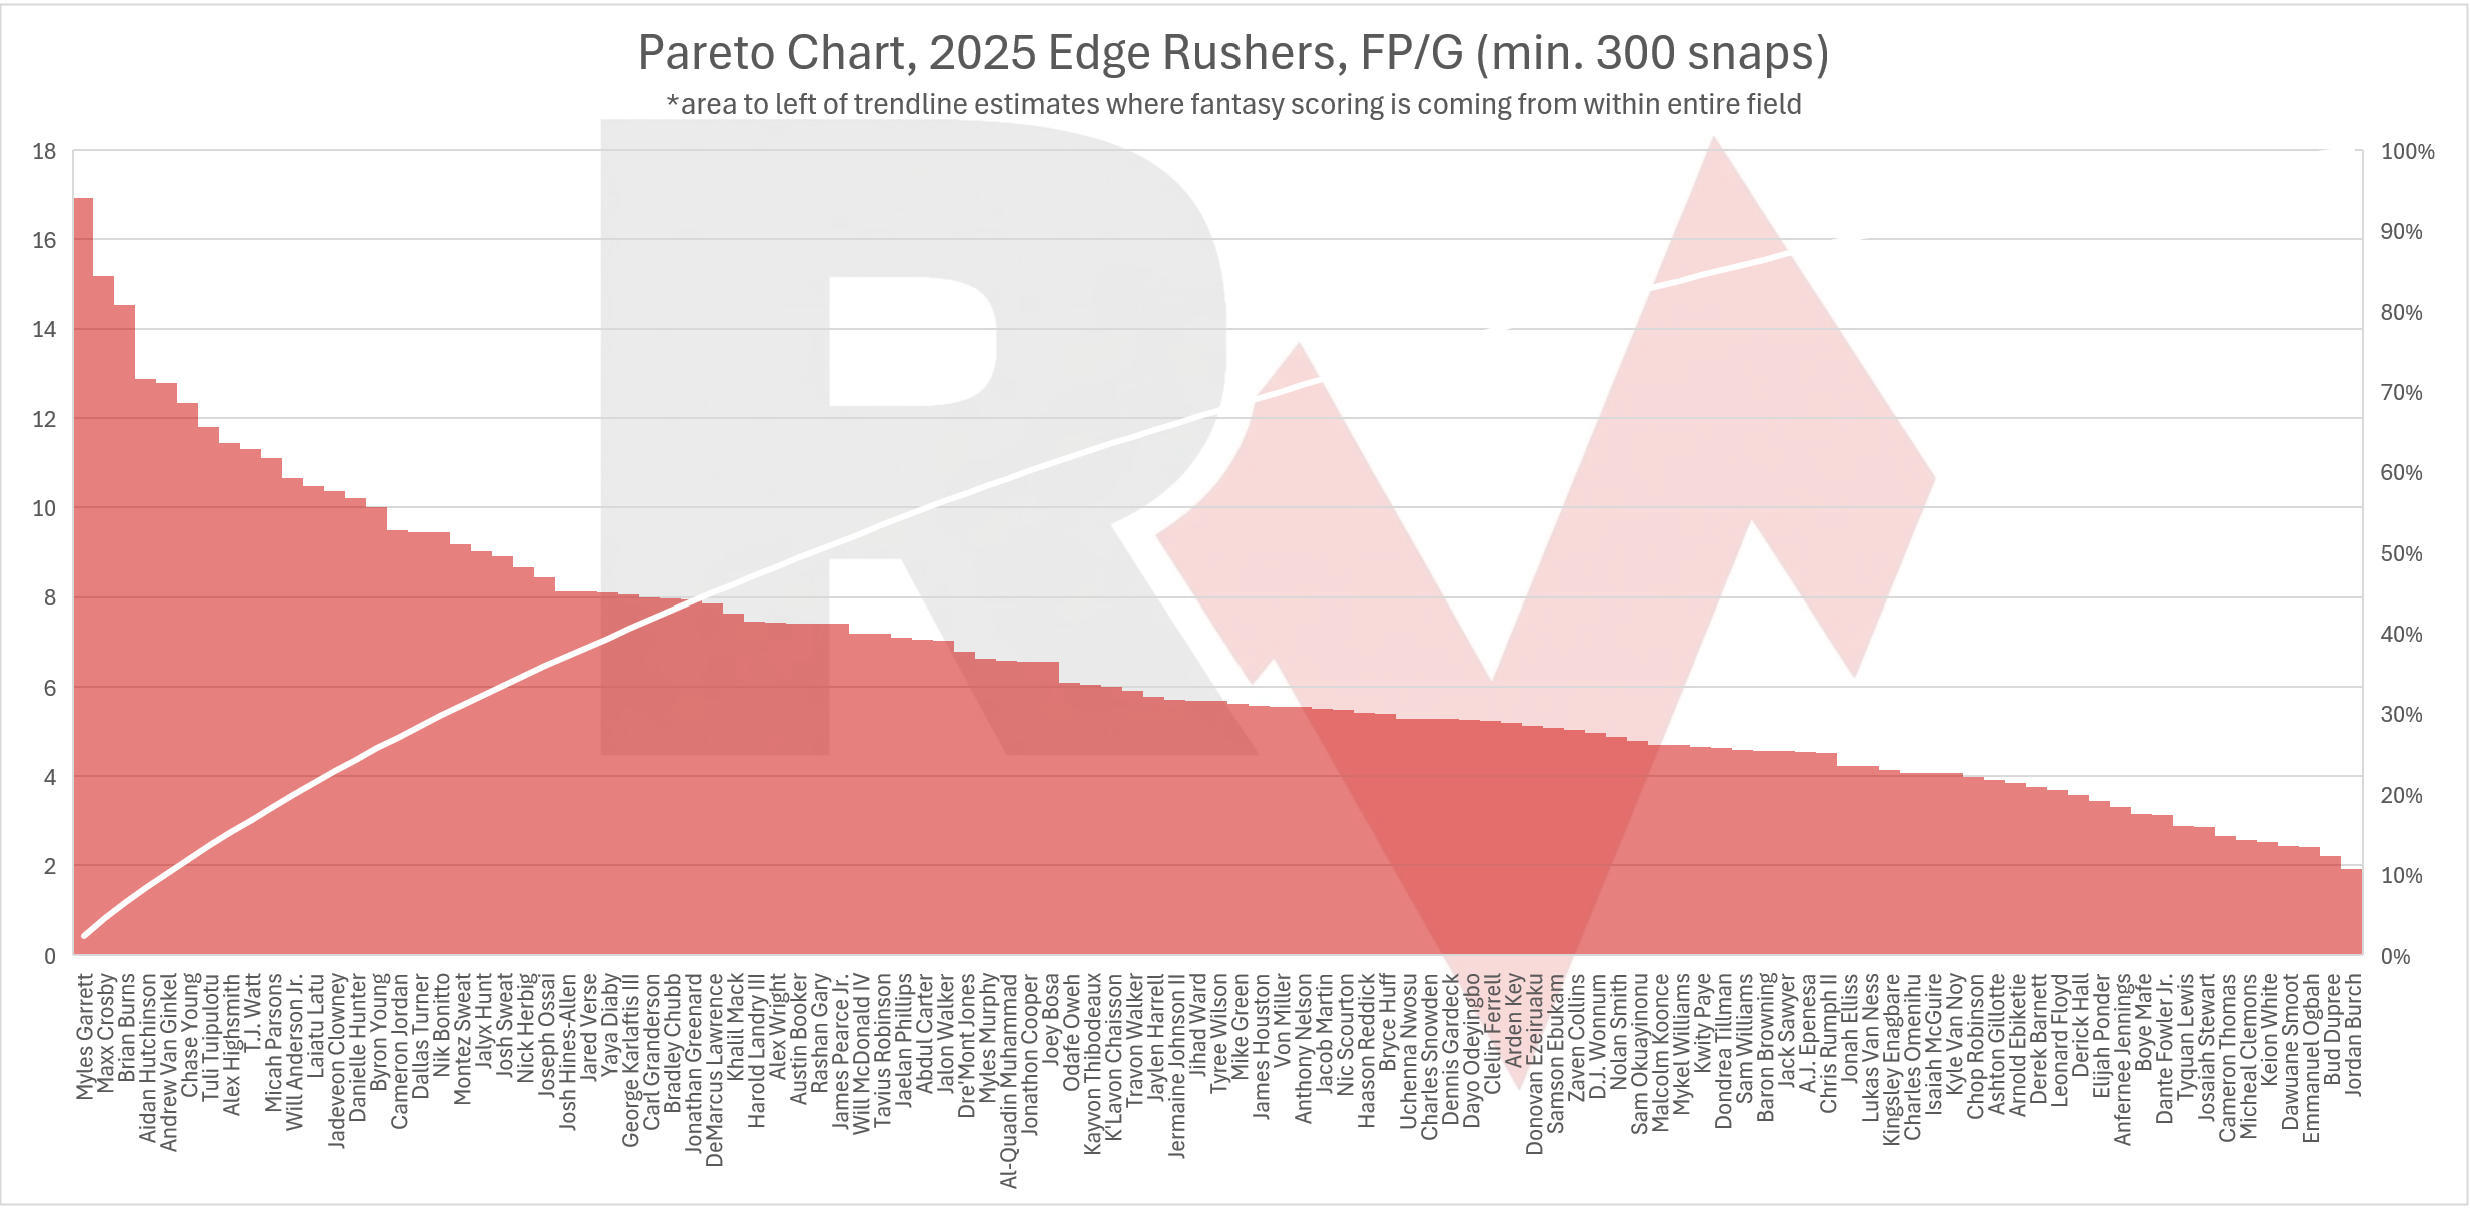
EDs seem to be the most top-heavy, with a sharp descent in fantasy scoring that begins almost immediately. Superstars like Myles Garrett, Aidan Hutchinson, or Maxx Crosby score far more than their counterparts, and their results are far more stable year over year (YoY). That should create urgency to acquire them early in the drafting process. Once the position flattens, however, that urgency should turn to apathy.
Speaking of apathy, DLs are valuable against themselves but should likely receive no flex consideration at all, as they simply score less in general. They also have tricky YoY correlation, so the apex is harder to pin down.
CBs seem to be pretty random YoY and flat, and, given their abundance, they should probably be prioritized less than K.
S is a bit less flat but largely tells the same story, though its greater tackling potential creates stickier and more flex-worthy production than we find at CB.
At CB, players who play in the box in nickel situations, like Cooper DeJean and Brian Branch, and players of that same archetype at S, such as Kyle Hamilton and Derwin James, should offer an advantage over their positional peers. However, I would speculate that the market overpays for that advantage.
But those were mostly observations made by looking at each position in isolation. That’s useful, but it isn’t really how fantasy football works. I don’t care that a DL is more valuable than other DLs if the same draft capital could buy me an ED who gives me a much larger advantage. And once I’ve filled my mandatory starting spots, I don’t care which position a player belongs to at all. I just want to know who belongs in those two flex spots. That’s RotoViz 101: Win the Flex.
What I really need, then, is a way to compare the value created at one position with that created at another.
Enter VORP.
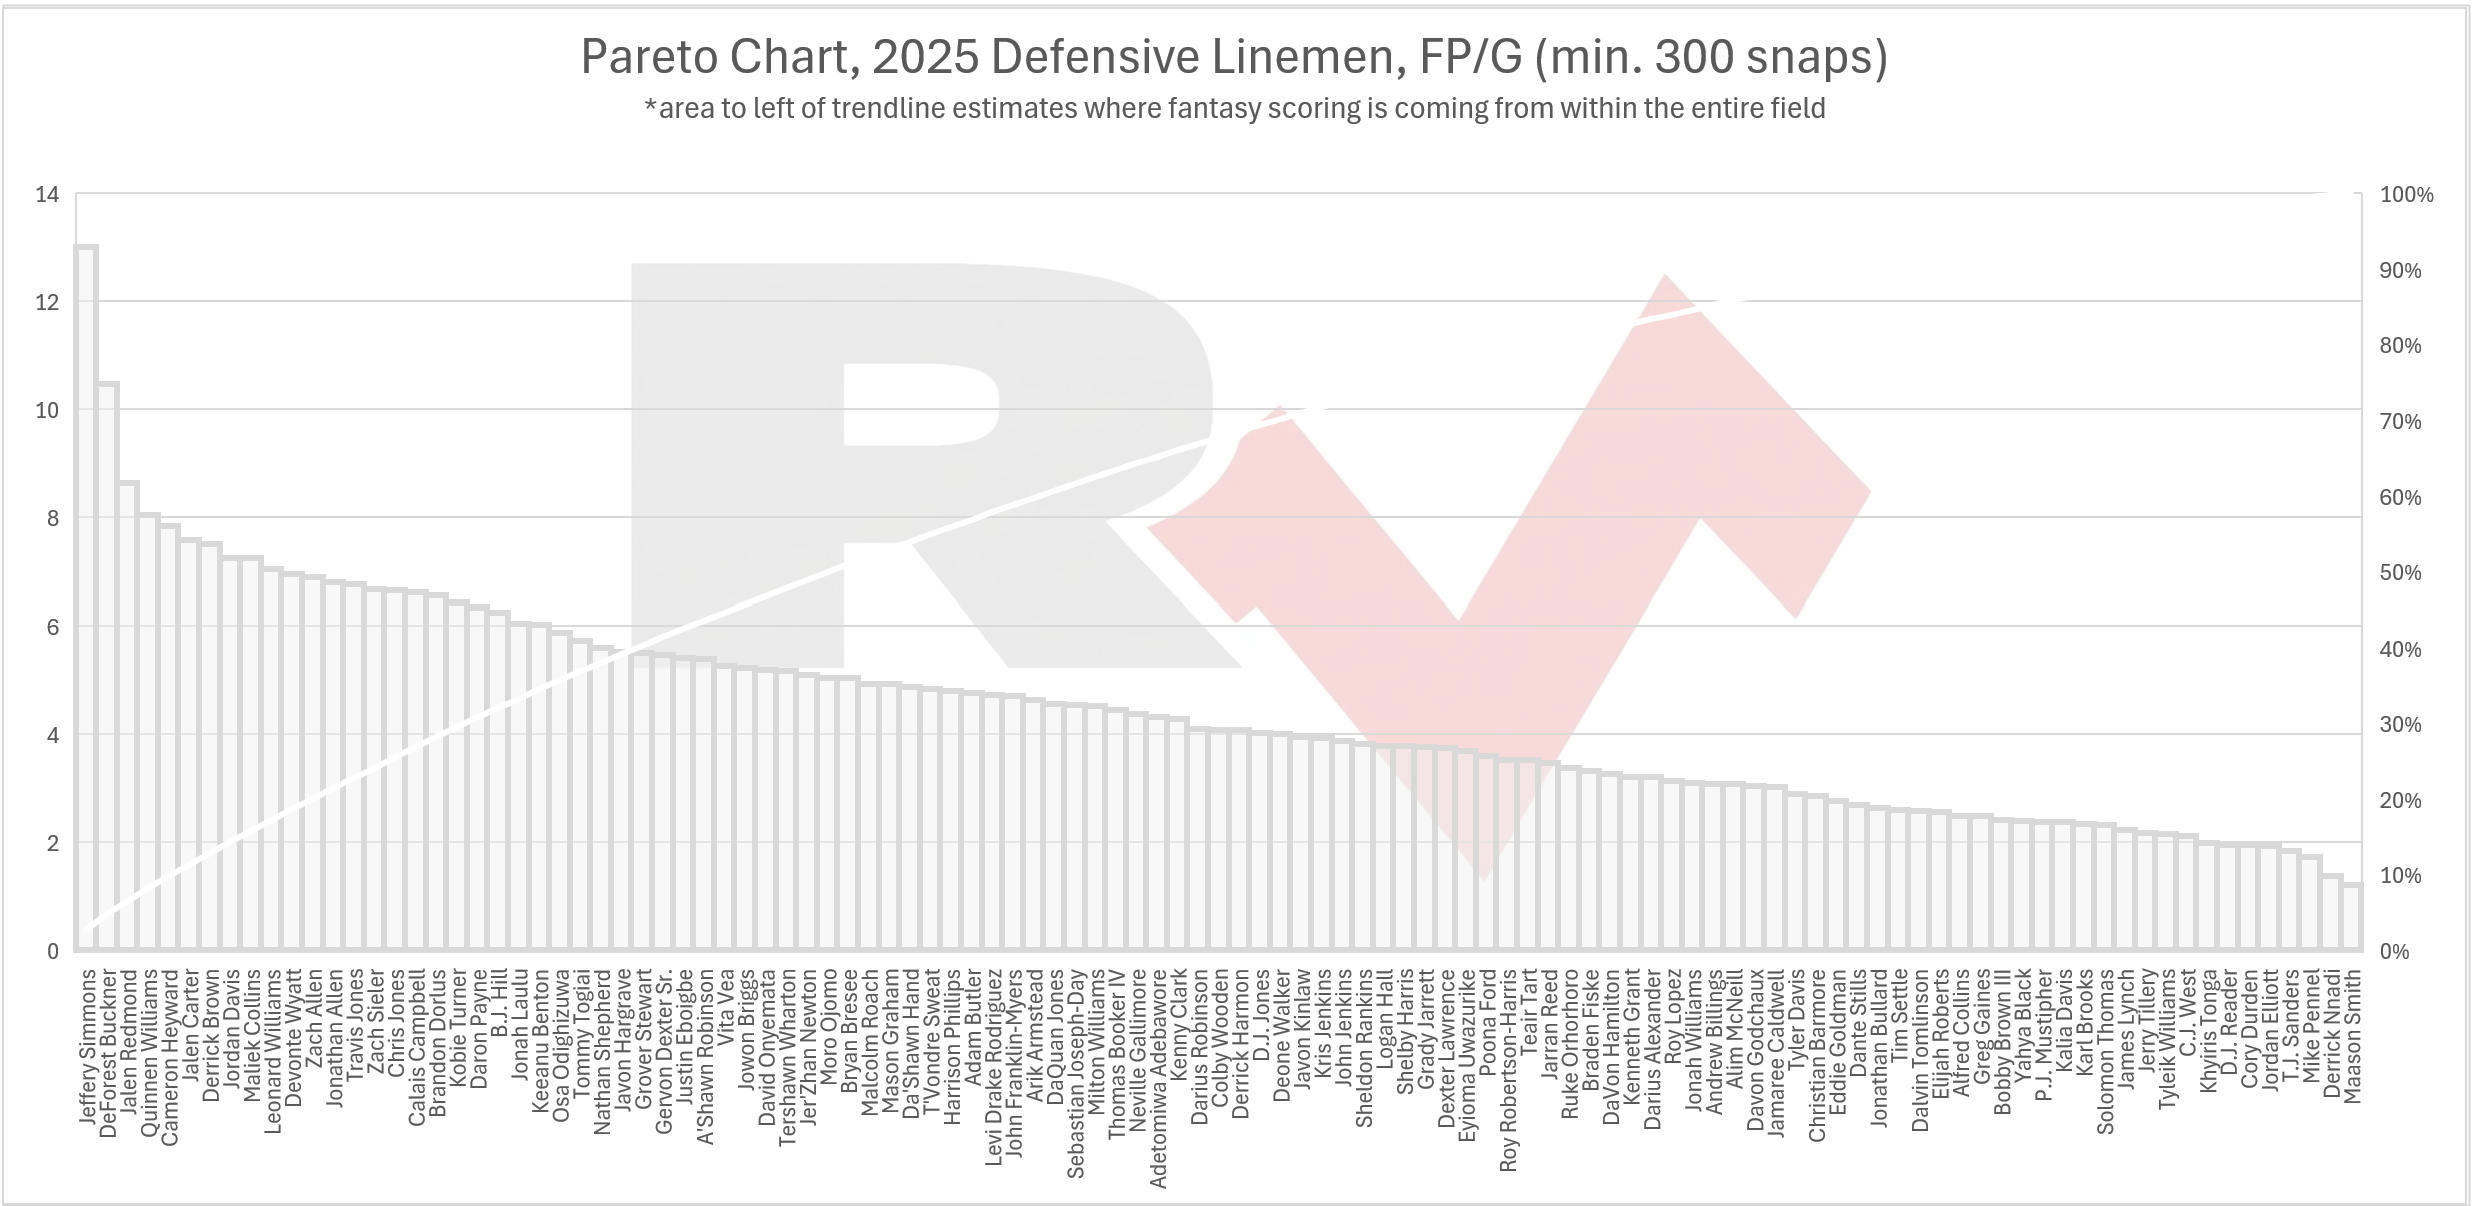
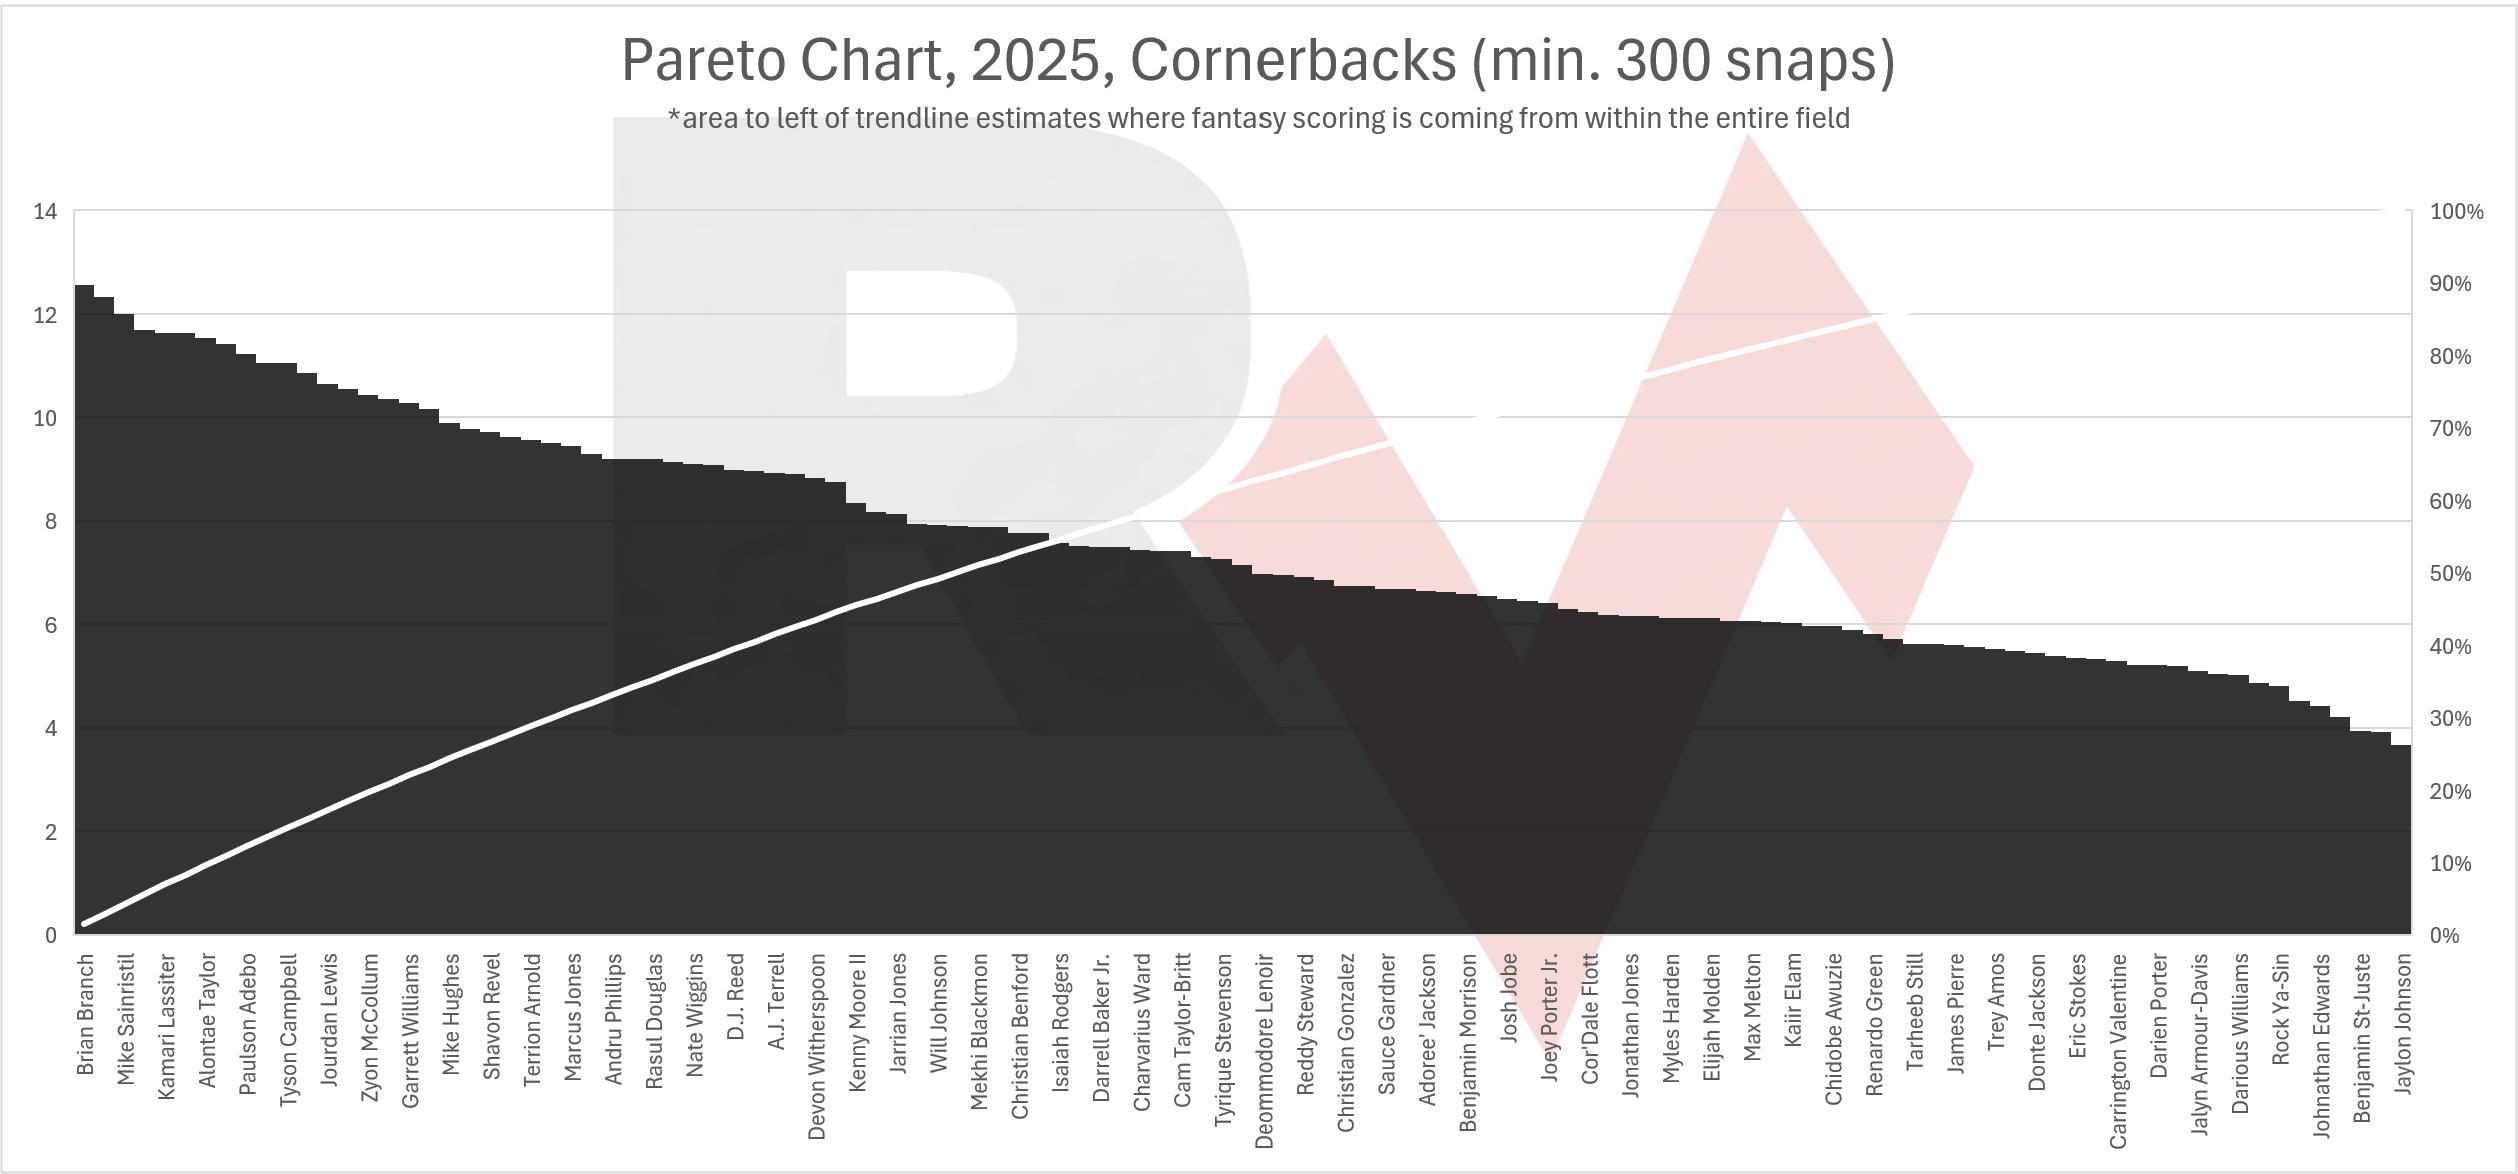
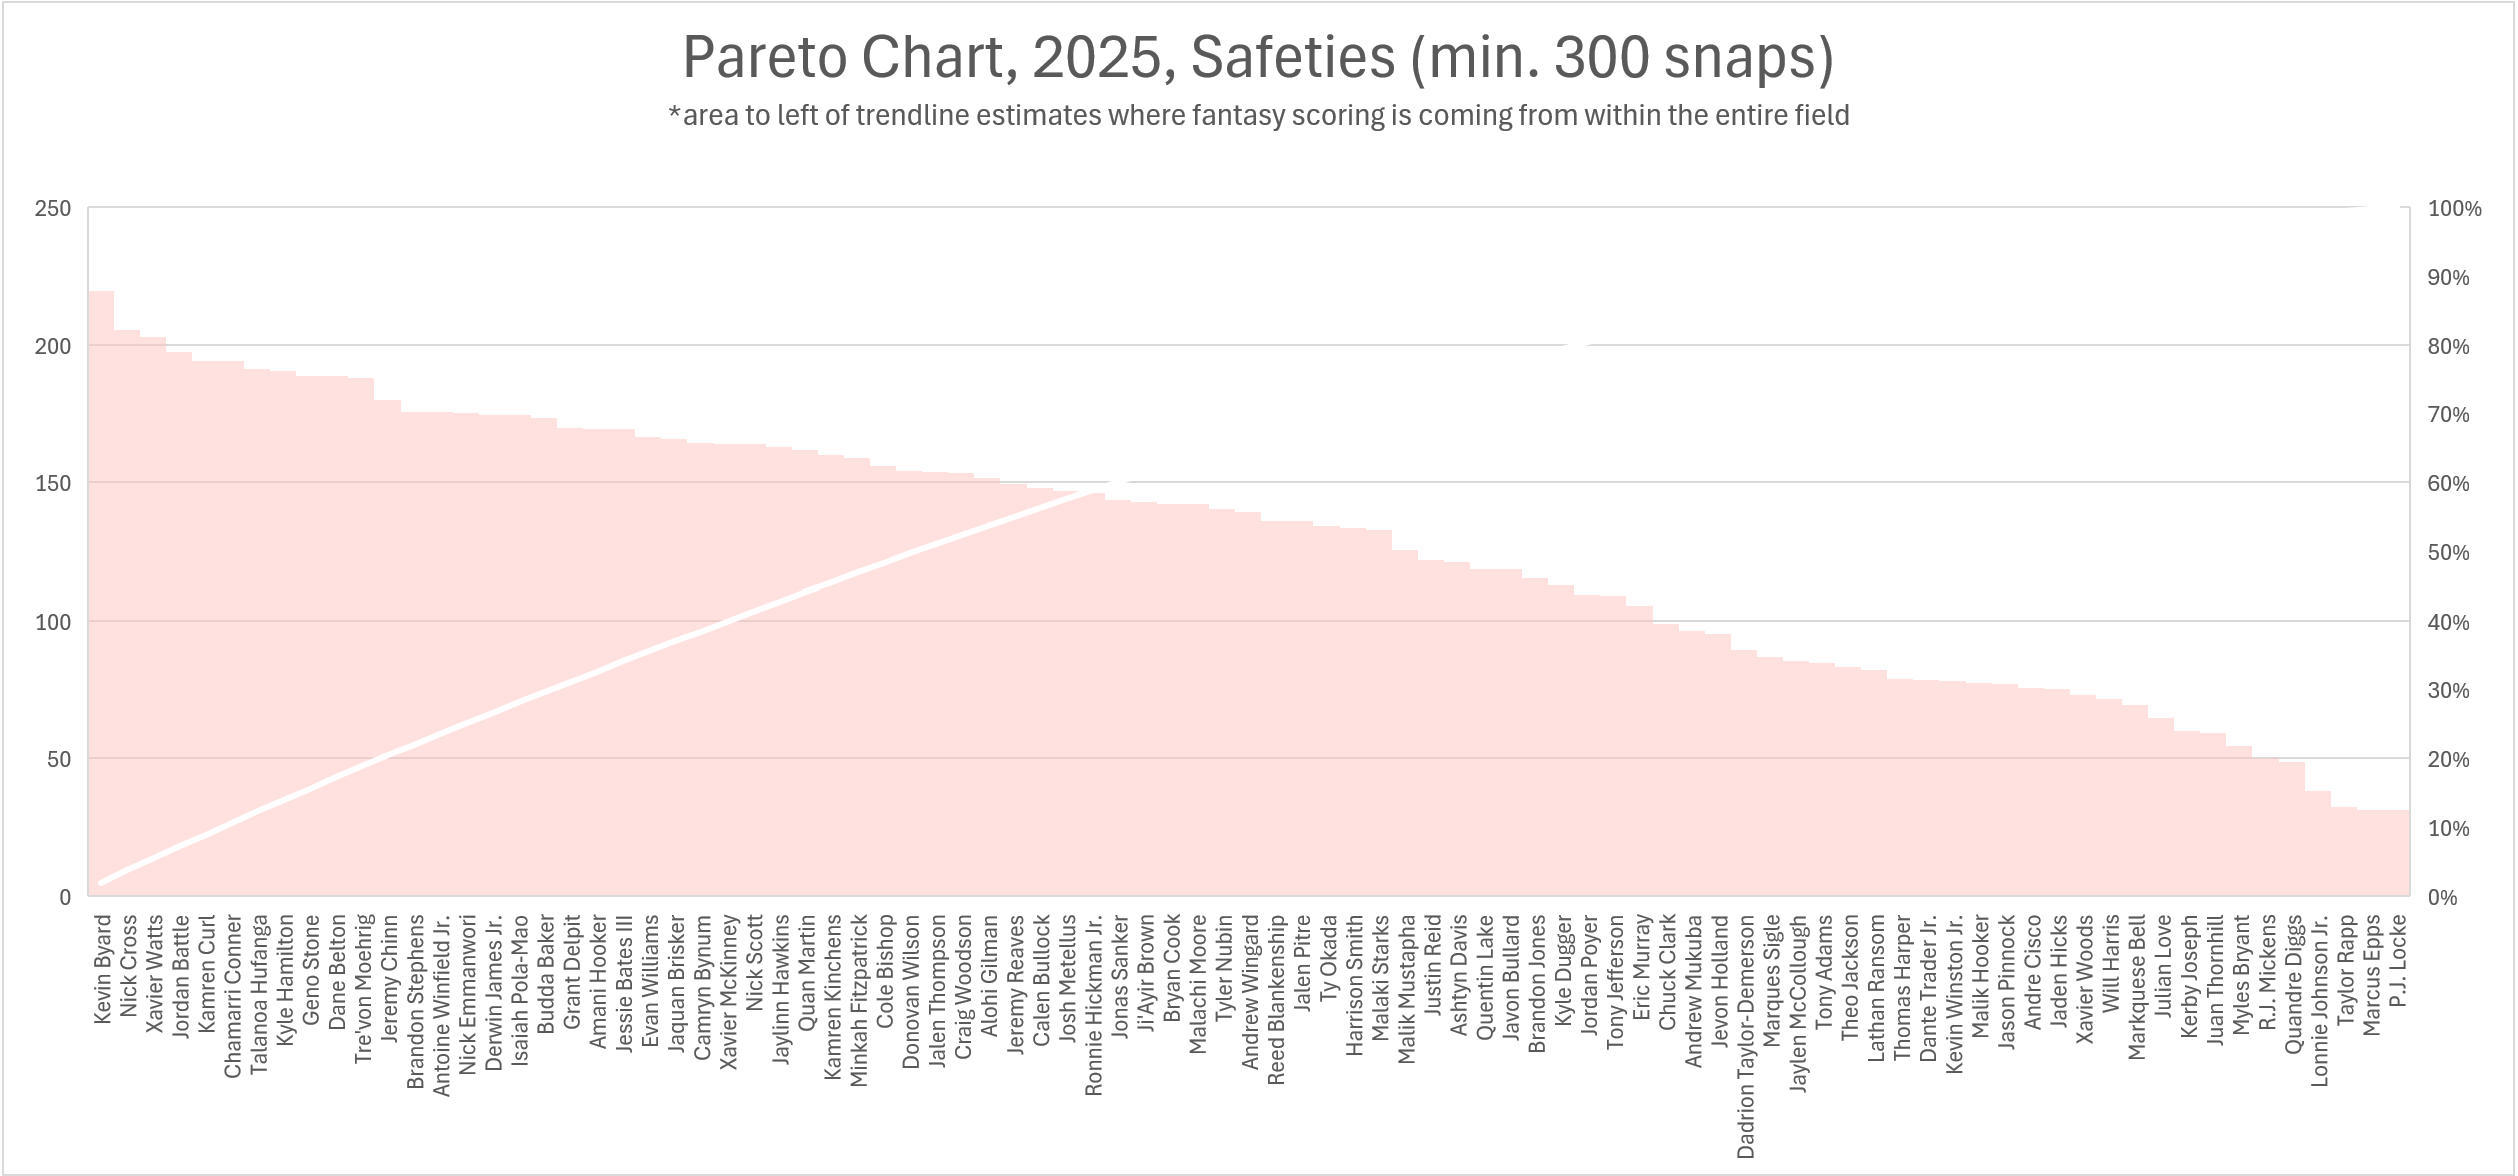
The Green Dot, Vol. 2: Using VORP to Reinforce Positional Value and Win the Flex in IDP Leagues
Macro fantasy strategies are all well and good, but at this time of year you have to give the people what they want: helping them find the players who will help them win their leagues.
Jesse Cohen made his RotoViz debut last year with his 2025 Masked Profiles, and now he is back with a brand new list for 2026:
Masked Profiles Recap
In Not Catchable but Still a Catch? Finding “Masked Profiles” for 2025, we leveraged the Advanced Stats Explorer to identify a group of buy-low targets ripe for positive regression.
That cohort, which had an aggregate -176.1 FPOE in 2024, finished the 2025 fantasy season with an aggregate +91.5 FPOE — led by strong performances from George Pickens (+59.9 FPOE), Dalton Kincaid (+41.5 FPOE), Christian Watson (+36 FPOE), and Alec Pierce (+29 FPOE) — for a total swing of +267.6 FPOE or +12.2 FPOE per player. For context, that’s about the same positive FPOE that Tetairoa McMillan (+13.1 FPOE) and Davante Adams (+12.1 FPOE) had last year.
It wasn’t all roses; Adonai Mitchell (-23.6 FPOE), Xavier Worthy (-17.1 FPOE), and Calvin Ridley (-11.6 FPOE) each failed to match the hype. And a handful of undraftable players dragged down the overall cohort results like Jalen Tolbert (-7.0 FPOE), Elijah Moore (-5.0 FPOE), and Brandin Cooks (-4.4 FPOE). As noted last year:
The “Masked Profiles” list is not a “breakout score” or a “fantasy hack” — this is still buy-low bin shopping and your discretion is required — but maybe, a helpful nudge in refining mental buckets.
I was excited to jump back into this analysis.
2026 Masked Profiles
Change from CT% to CTOE
The original hypothesis of Masked Profiles was that:
a low Catchable Target % (CT%) in year N, especially when combined with other suppressed traits like low YPRR or low YAC/Rec, could help surface players whose talent or opportunity might have been masked by quarterback play, scheme, pressure rate, or simply bad luck on the relatively small sample that is an NFL season.
This year, following a suggestion from Blair, we’re using Catchable Target % Over Expectation (CTOE) instead of raw CT% to isolate catchable rate from aDOT. This led to mostly similar results, but with a more well-rounded set of target-earning portfolios in the cohort.[1]
The 2026 Masked Profiles List
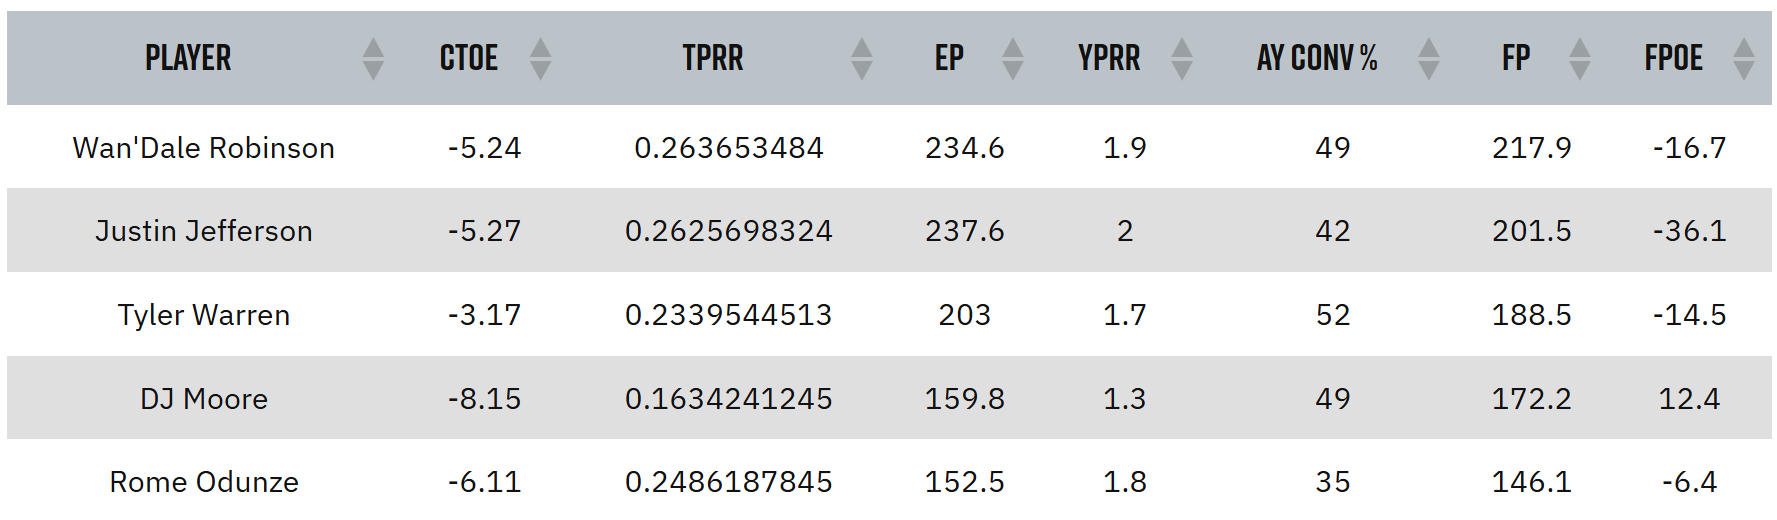
The names on the 2026 Masked Profiles List are really fun. As a reminder, a player must have a bottom-quartile CTOE as well as a bottom-quartile mark in at least one of the other listed traits in order to qualify for the list:[2]
We have superstars and a potential superstar:
-
It’s hard to believe that prime Justin Jefferson (-5.27 CTOE) could be in the bottom quartile of the league in converting air yards,[3] but 2025 was truly a debacle in Minnesota. He’s as safe a bounceback candidate as they come.
-
Garrett Wilson (-7.89 CTOE) suffers the indignity of appearing on a Masked Profiles list for a third time.[4] Geno Smith could provide Wilson a healthy share of catchable targets for the second time in his career.
-
Tyler Warren (-3.17 CTOE) was a big target for the Untimelies and is, per Shawn, the best pick on the board right now in FFPC drafts. Considering what he did last year as a 23-year-old, Warren has become sneaky-young for his production.
Not Catchable but Still a Catch: the 2026 Masked Profiles List
Omar Pierre is the newest member of the RotoViz team, and he has been making his mark profiling the NFL’s exciting crop of second-year running backs. In this most recent article, Omar discusses the chances four Year-2 RBs have of hitting from the late rounds, including an in-depth breakdown of the Cleveland Browns’ backups:
Dylan Sampson — RB 53, ADP 172.8
For more on the Brown’s outlook in 2026, check out Part 1
Dylan Sampson’s sample size from Year 1 is small, but strong underlying metrics boost his case for 2026.
After the Browns’ Week 9 bye, for running backs with a minimum of 10 targets, he posted 2.0 yards per route (8th), 13.5 yards after catch per reception (1st), and 10.8 yards before catch per reception (1st).
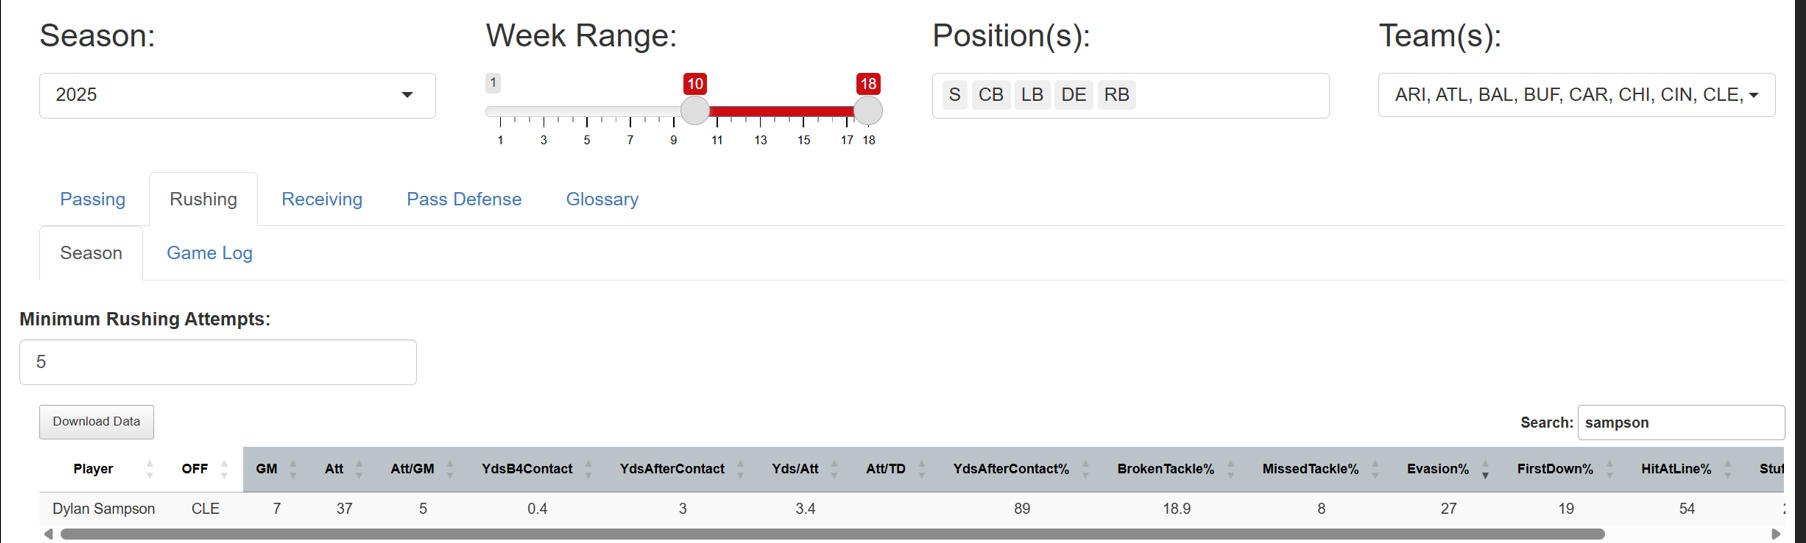
After their Week 9 bye, Sampson also flashed on the ground. He posted an 18.9% broken tackle rate and a 27% evasion rate. Among backs from the same period with a minimum of 20 carries, that would rank fifth and eighth. It’s a small sample, but a solid signal that Sampson can provide more than just receiving production.
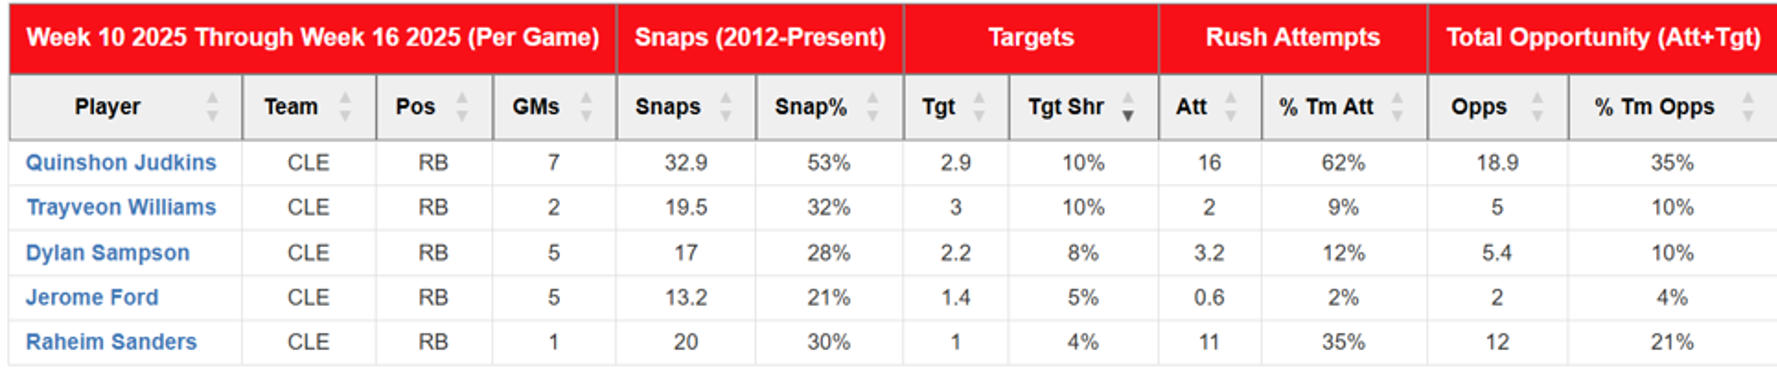
Both Sampson and Judkins saw a bump in routes run and target share as Jerome Ford’s playing time dwindled. However, Quinshon Judkins still led the Browns in target share in games they were both active. But it was nice to see Sampson move ahead of Ford in the latter half of the season.
We got a small glimpse of contingency value in weeks 17 and 18 after Judkins’ season-ending injury. Sampson was able to consolidate targets, but it was pretty clear this was more about the state of Cleveland’s depth chart in 2025 as they played out the end of the season. While the Browns did not add much to their running back depth chart, teammate Raheim “Rocket” Sanders should compete for touches if Judkins misses time.
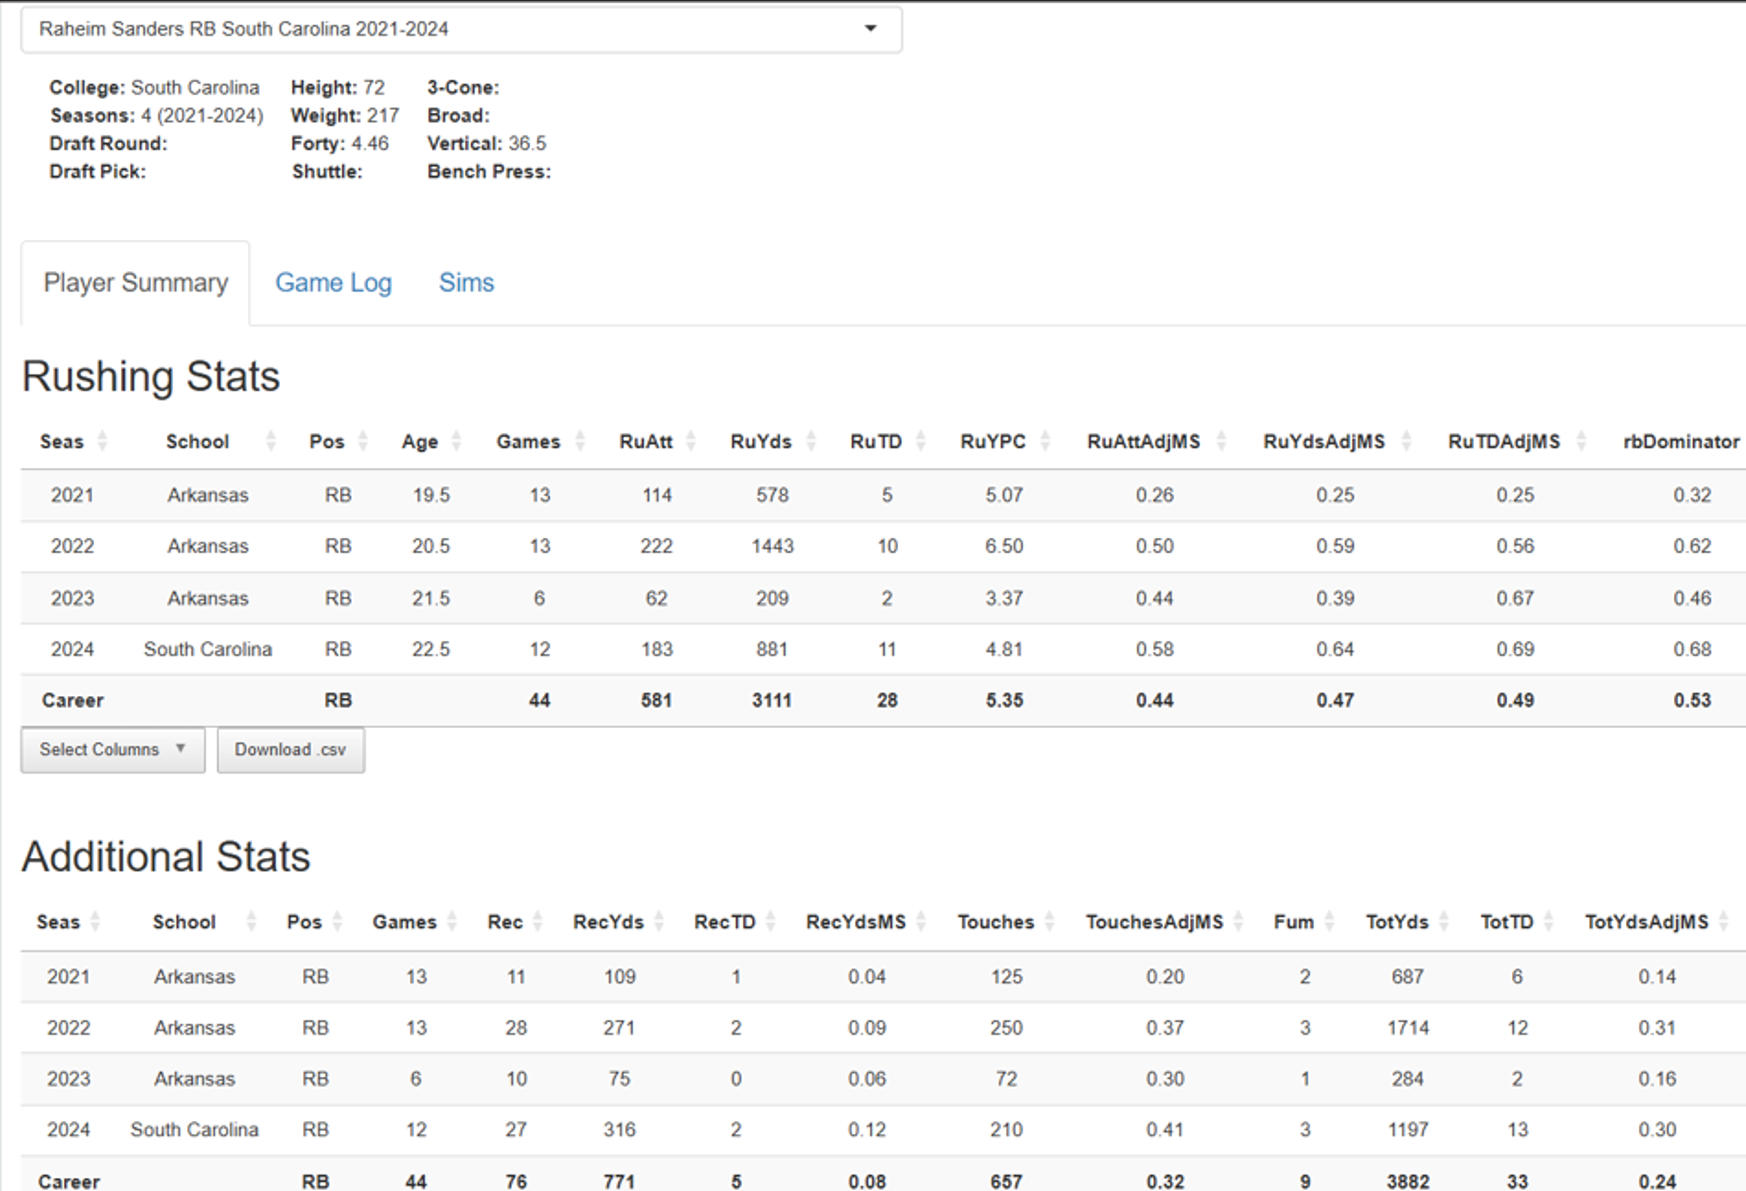
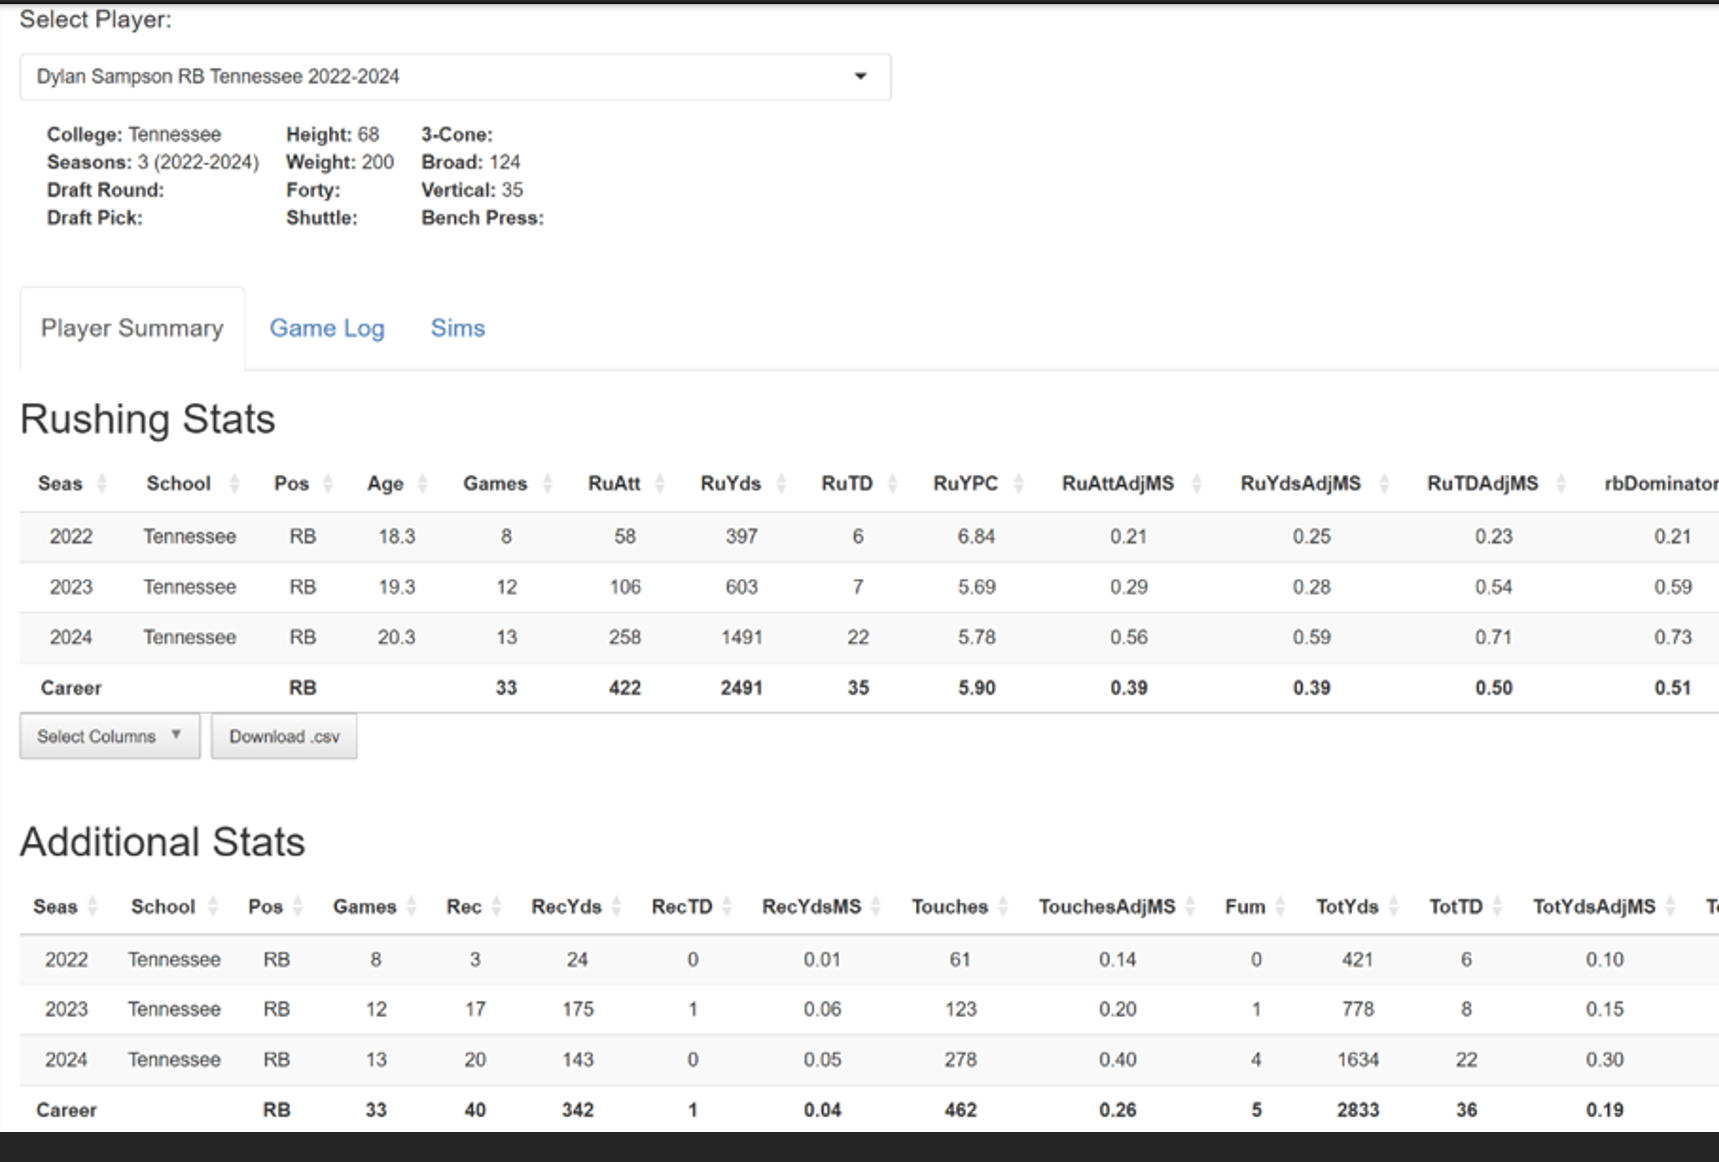
The Browns added Sanders after he went undrafted and subsequently was waived by the Chargers before the 2025 season. If we go back to the college profile, Sanders actually had better receiving production than Sampson at South Carolina and Arkansas.
While Sampson was clearly ahead of Sanders on the depth chart for the Browns last season, there is at least some risk that after a full offseason program with the Browns, Sanders could cut into Sampson’s projected receiving role. And if Judkins were to go down, the backfield split could be closer to 50-50, rather than a full takeover by Sampson.
How it pays off: The Browns value Sampson’s receiving peripherals and make him the clear receiving back in 2026, providing real standalone value alongside Judkins.
How it fails: The narrative that Judkins is a two-down grinder is false, and Judkins assumes a full lead back role, leaving minimal touches for Sampson to earn.
Verdict: As mentioned in my piece on Judkins, I think some of the narrative that Judkins is a zero in the passing game is misconceived. The Browns could easily treat Judkins as a true workhorse, both on the ground and enough in the passing game that there isn’t enough left on the pie for any secondary Browns back to matter. However, the receiving metrics for Sampson, even if on a small sample size, were good enough that I think the Browns would be wise to carve out a role to utilize his skills in the passing game.

Are These 2nd-Year Backs Poised to Take a Sophomore Leap? The Cost of Optimism, Part 4
On the other end of the spectrum, Thomas Emerick is a seasoned RotoViz veteran, and he’s back for Year 12 of his offensive line continuity series:
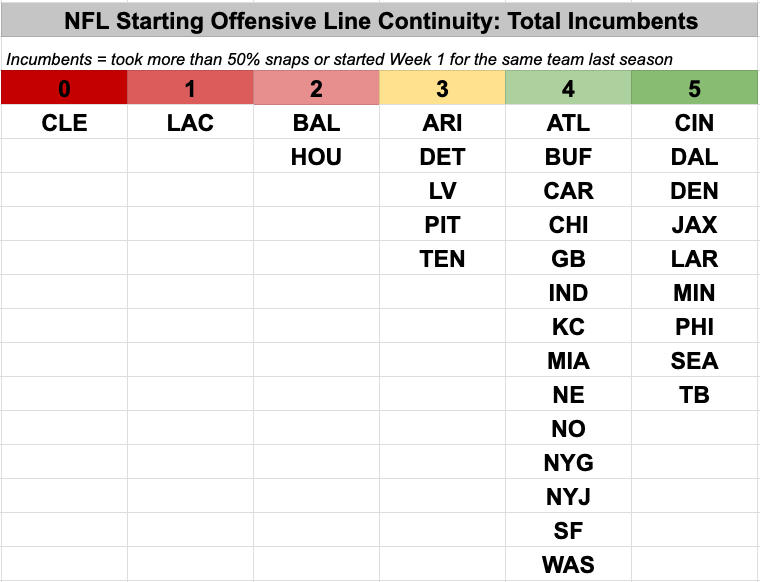
Denver has taken the continuity mantle of the 2020s.
Indianapolis likewise featured the same five starters over a three-year stretch before shuffling things a bit the last couple of years. However, tackle-to-tackle, that squad does not compete with this current Broncos offensive line, even with Quenton Nelson being the single best player of the 10. Denver also now has its own elite guard in Quinn Meinerz.
Through much of the 2010s, the dynamos of both continuity and personnel were the Eagles, Steelers, and Cowboys. You could count on those units setting their offenses up for success whether you were drafting in February or August. They had elite line coaches in place too, among them Jeff Stoutland (Eagles), Bill Callahan (Cowboys), and Mike Munchak (Steelers).
Denver is vying to get on that level.
The previous edition of this series tackled the teams on the lower end of the continuity spectrum, and this time we’ll dive into the teams returning all five offensive line starters.
Offensive Line Continuity by Team Entering Preseason
Let’s split the nine max-continuity starting offensive lines into three categories of aspiration heading into the post-Hall of Fame Game part of the preseason and training camp schedule. These groupings will be: Competing for the Elite Tier, Getting to Reliably Good, and Sneaking Back to Average.
The right end of the chart above is typically longer at the start of preseason than it is come Week 1 of the regular season. A lot can happen in August. However, we draft throughout the month with incomplete information, so here are the three categories of reasonable aspirations for the nine teams that boast starting offensive lines returning all starters.
Competing for the Elite Tier (among max continuity teams)
Broncos: They hit the trifecta in line continuity, a couple of top-end guys, and no weak links. Denver’s the only team featuring two players in the top 15 of Brandon Thorn’s offensive lineman rankings, and each lineman atop Denver’s depth chart ranks out to the equivalent of an average NFL starter or better — or, in the cases of right guard Quinn Meinerz and left tackle Garett Bolles, much better. It has Broncos whispering to us in the fourth round with Jaylen Waddle and the ninth with J.K. Dobbins or RJ Harvey.
Buccaneers: Tampa entered last season coming off a top-five pass-block win rate in 2024, then got blown apart by injuries as every starter outside center Graham Barton missed more than 30% of snaps. LT Tristan Wirfs getting in a healthy year helps Baker Mayfield recover that mojo.
Eagles: Right tackle Lane Johnson beat Wirfs for the top spot in Thorn’s OL rankings and gets the full benefit of continuity entering his hinted-to-be final season. Johnson and LT Jordan Mailata helped this unit grade out well in pass-blocking, but fell to middling in the run game, so a continuation of that would not be as bullish for Saquon Barkley.
Rams: You wonder how much McVay wizardry’s at play given they ranked top five in both pass- and run-block win rate, yet nothing jumps off the page save for maybe the C-RG duo doing nice work with C Coleman Shelton and the unit’s best player in RG Kevin Dotson. The Rams have done well in recent years to make this a well-oiled machine by maintaining continuity with average-ish starters at most spots. What’s killed them is at C, where in Shelton they’ve finally found someone solid who doesn’t tend to allow the ill-timed jailbreak on Matthew Stafford.
Are We Going Back to the Well on J.K. Dobbins? NFL Offensive Line Continuity, Preseason Edition
We definitely take pride in covering teams top to bottom here at RotoViz. This has been a primary focus of my coverage of the best and worst picks for all 32 teams this summer. To get a taste of the depth of information that has been discussed throughout the series, here is a snippet of my recent write-up of the Atlanta Falcons:
Raheem Morris only lasted two years in Atlanta before the Falcons’ decision-makers decided it was time to take the team in a different direction. But it’s not like Morris’ time in Atlanta was a disaster; he led the team to matching 8-9 records. Still, it was disappointing to watch the Falcons miss the playoffs in back-to-back years while playing in objectively the weakest division in football.
While it’s fair to say that Atlanta’s play was mediocre all around, there were some highlights over the past two years, particularly on offense. Despite finishing 13th in scoring in 2024, the Falcons were a top-10 team in both passing and rushing that year, finishing sixth in total offense. Last season, the passing game took a big step backward, but the rushing attack finished inside the top 10 for a second consecutive season.
It is fair to question the efficacy of new head coach Kevin Stefanski’s passing game in Cleveland. Yet, he should be able to keep the running game on track. Stefanski will be handing over play-calling duties to offensive coordinator Tommy Rees after the latter held the same responsibilities in Cleveland from Week 10 onward last season.
Information regarding Rees’ play-calling tendencies at the NFL level is limited, but it is promising that he called plays at two big-time college programs — Notre Dame from 2020-2022 and then Alabama in 2023 — before joining Stefanski’s staff as a tight end coach and pass game specialist in 2024. One year later, he was promoted to offensive coordinator at age 33.
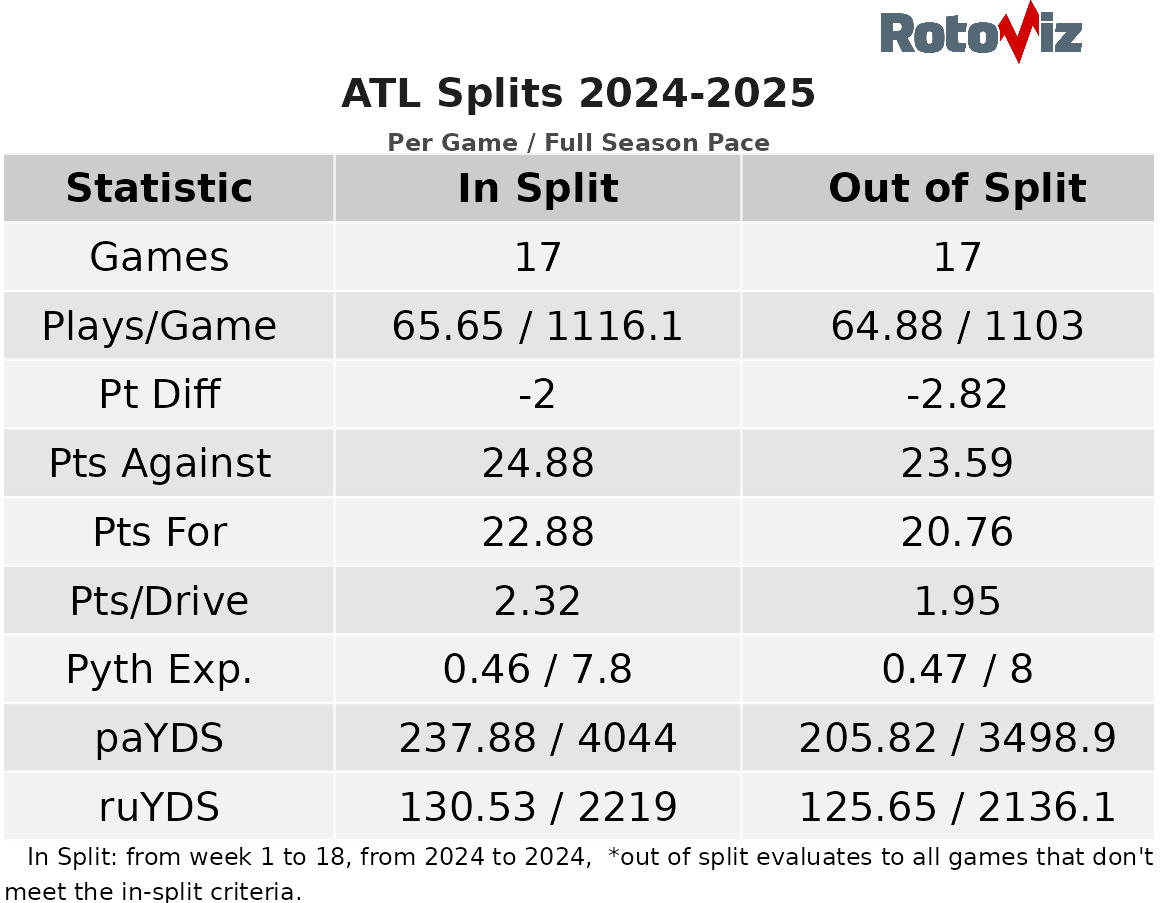
Given Stefanski’s trust in Rees, we shouldn’t expect the Falcons’ offense to deviate too dramatically from what we saw during Stefanski’s six-year tenure in Cleveland. To get a feel for the changes that might be coming in 2026, we can compare Cleveland’s pace numbers from 2020-2025 to what we saw from Atlanta’s Zac Robinson-led attack over the past two seasons.
OVERALL PACE
The most important takeaway here is Cleveland’s average plays per 60 minutes compared to Atlanta’s. While both teams averaged the same number of run plays per 60 minutes, the Browns held the advantage in pass plays. That increase led to Cleveland tying for second in average plays per 60 minutes since 2020, while the Falcons tied for 15th over the past two seasons.
NEUTRAL SITUATIONS
When we look at neutral game scripts, it is difficult to imagine how the Browns got so far ahead of the Falcons in play volume. Robinson’s seconds per snap (third) and no-huddle rate (t-eighth) were far ahead of Cleveland’s rankings in the back half of the league.
LEADING BY 7+ POINTS
Once we move past neutral situations, the reason for the discrepancy in play volume starts to become clearer. While Atlanta remained close to the top of the league in no-huddle rate when leading by a score or more, they plummeted to the bottom of the NFL in sec/snap (31st) and pass rate (32nd).
Meanwhile, the Browns move ahead by largely holding steady in their rankings of sec/snap (t-17th), no-huddle rate (t-25th), and pass rate (t-21st).
TRAILING BY 7+ POINTS
Where we really see a big difference in Cleveland’s pace numbers is when they trailed by a score or more. In these situations, the Browns picked up the tempo, tying for sixth in sec/snap, 10th in no-huddle rate, and 15th in pass rate.
While Robinson continued to rely on no-huddle (t-ninth) more than the majority of the teams in the league, his sec/snap (18th) and pass rate (26th) fell to the bottom half of the league. Given that Atlanta ran 23.4% of their offensive plays over the past two years trailing by a score or more, these trends brought down their overall play volume considerably.
As I mentioned earlier, we shouldn’t expect Rees’ play-calling tendencies to mirror Stefanski’s exactly. Regardless, we will probably see the Falcons lean into the passing game a bit more while cutting down the amount of time the offense spends in the no-huddle.
No matter what changes we see Rees and Stefanski bring to Atlanta this year, the offense is still going to run through Bijan Robinson, Drake London, and Kyle Pitts.
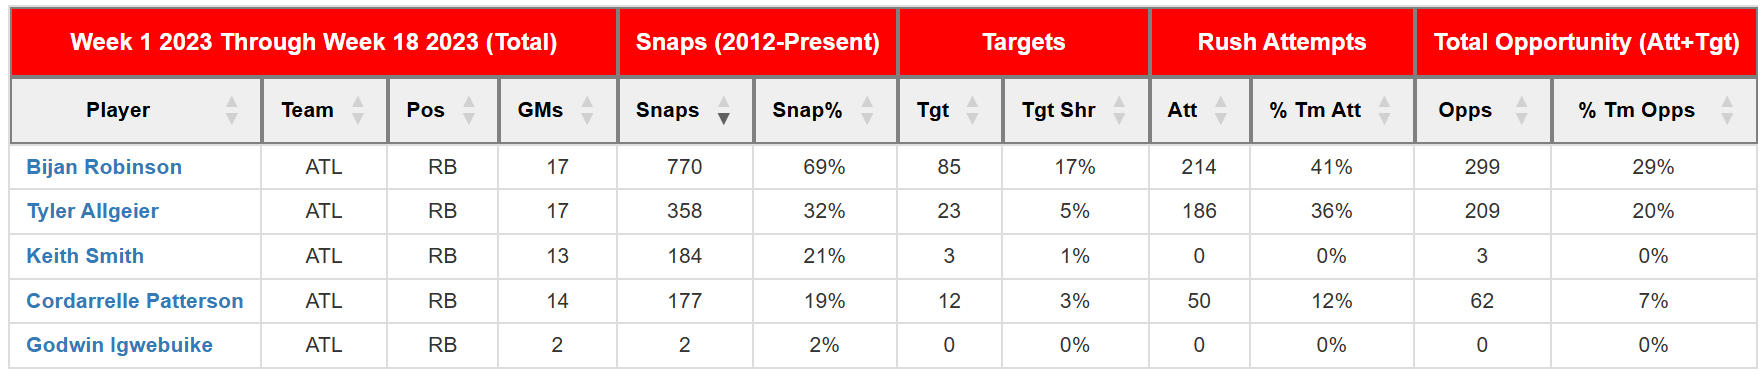
Bijan Robinson is the primary engine of this offense. As a rookie under Arthur Smith, he finished as the PPR RB8 despite giving up more touches to Tyler Allgeier than seemed logical.
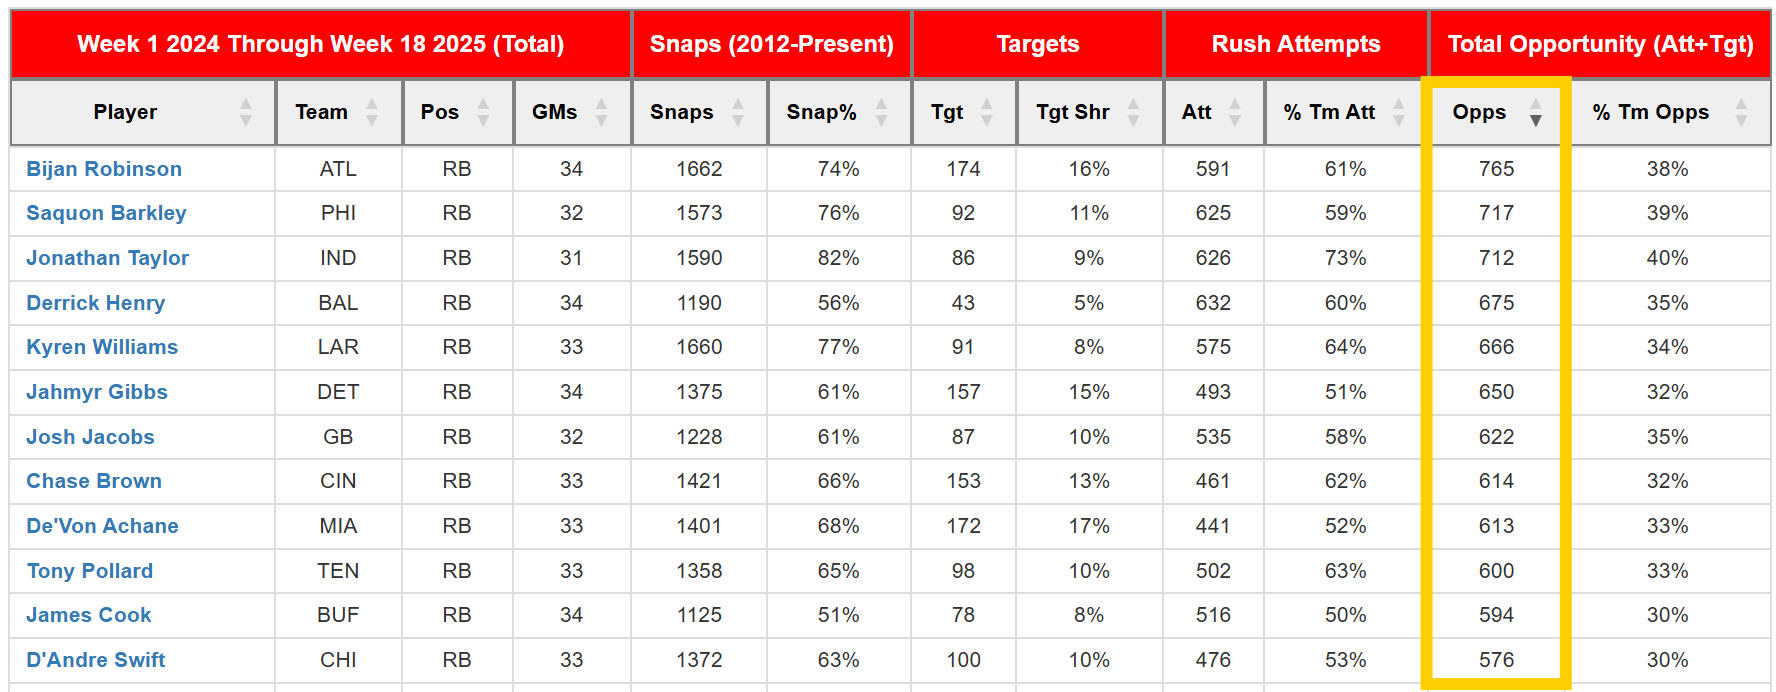
But in the past two years under Zac Robinson, Bijan Robinson has played more snaps and earned nearly 50 more total opportunities (first in targets and fourth in carries) than any other running back in the league. The uptick in usage has resulted in him finishing as a top-three fantasy back in each of the past two years.
Although Stefanski’s time in Cleveland ended poorly all around, he fielded a top-six rushing attack in each of his first three seasons by relying on Nick Chubb and Kareem Hunt. With all due respect to Chubb and Hunt, neither of them possesses the all-around skill set of Bijan Robinson. Meanwhile, the talent gap between Brian Robinson, the presumed RB2 in Atlanta this season, and Bijan Robinson is much wider than that of Chubb and Hunt.
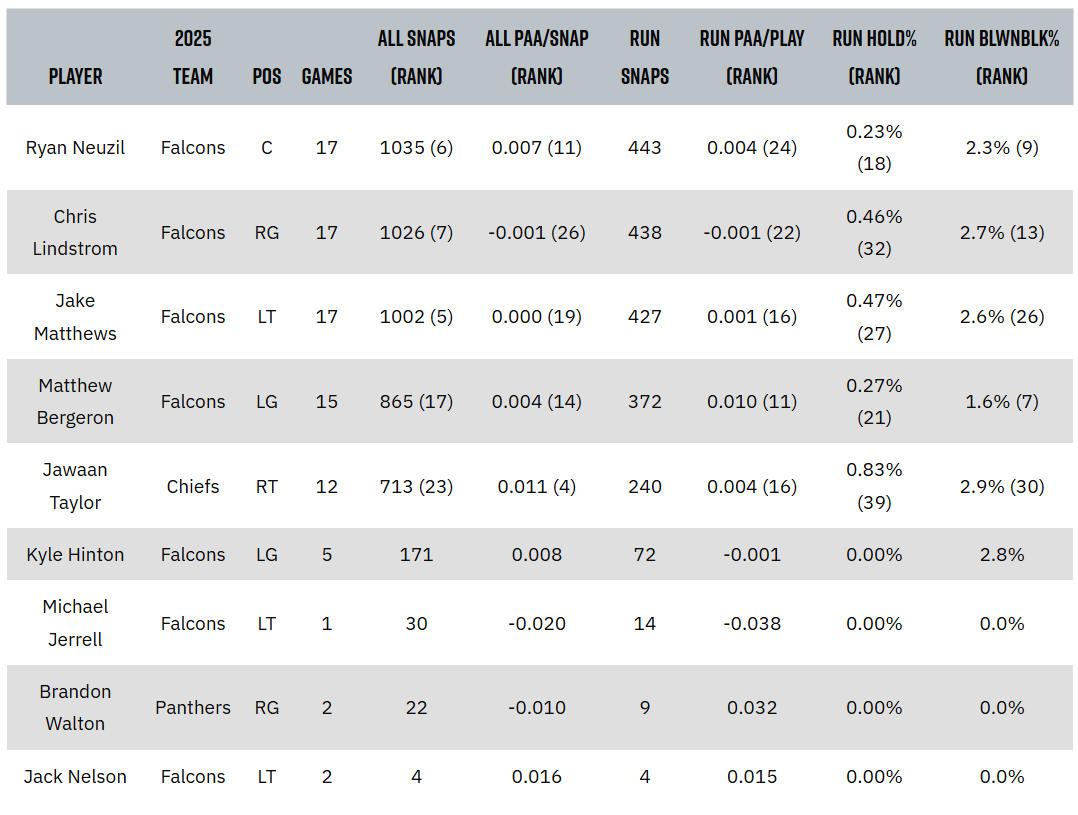
While the offensive line remains suspect — the unit ranked 23rd in points earned (PE) per play and 10th in blown block rate (BlwnBlk%) on run plays in 2025 — it hasn’t held Bijan Robinson back the past two seasons. Replacing departed right tackle Elijah Wilkinson with Jawaan Taylor should be considered an upgrade for the run game.
*Ranks are by position and only include players with at least 300 total snaps in 2025.
In addition to Bijan Robinson being incredibly productive through three NFL seasons, he has also been extremely durable. He has yet to miss a game in his career, and there is no reason to believe he hasn’t earned his place as a top-two pick in fantasy drafts this season.








Marrying historical trends with team-level analysis is also a part of our process, which has been a basis for Corbin Young’s small-gap backfield articles over the past several seasons:
With NFL training camps ramping up, we’ll want to keep tabs on the running backs in these crowded or small-gap backfields for fantasy football purposes. In the past, we’ve covered several small-gap backfields to identify value in these murky situations. The idea comes from Jack Miller’s research on the win and hit rates for big or small gap backs, and from similar research by Charlie Kleinheksel before that.
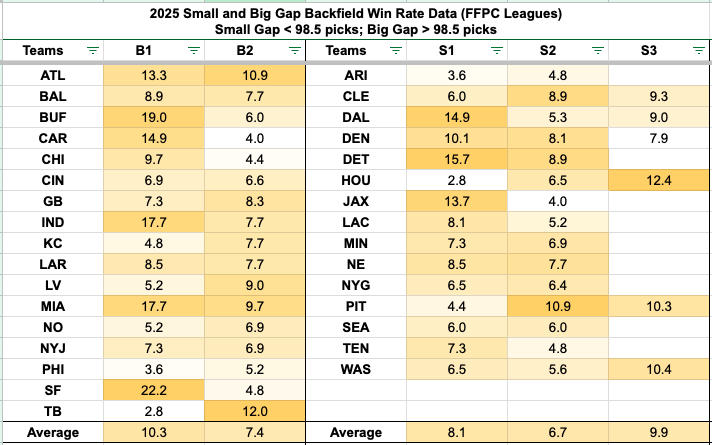
First, let’s define our terms: B1 and B2 running backs refer to a team’s RB1 and RB2 in backfields with an ADP gap of 98.5 or more. Players in backfields with a smaller gap between the RB1 and RB2 are referred to as S1 and S2, respectively. It could be a one-season sample, but we saw a few S3 backs having higher win rates last season.
Historically, B1 and S2 backs have produced the best win rates, but at very different costs. B2 backs have produced average win rates, while S1 backs have historically been the worst performers.
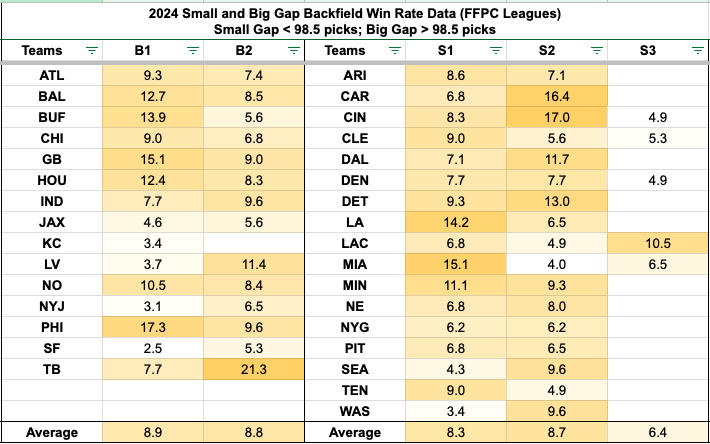
Last year was a down season for S2 backs, after an 8.7% win rate in 2024, aligning closer to the historical norms. There was a significantly higher win rate for B1 backs in 2025, as those high-end running backs drafted early were healthy and productive. The data from 2024 is below. That season, Isiah Pacheco fractured his lower leg in Week 2, and the Chiefs signed Kareem Hunt. No FFPC teams drafted Hunt that season.
Today, we’ll focus on small-gap backfields who might give us an edge in our fantasy drafts. We’ll use the FFPC Redraft ADP to identify small-gap running backs.
Seahawks Backfield
Jadarian Price — 63.9 ADP, RB27
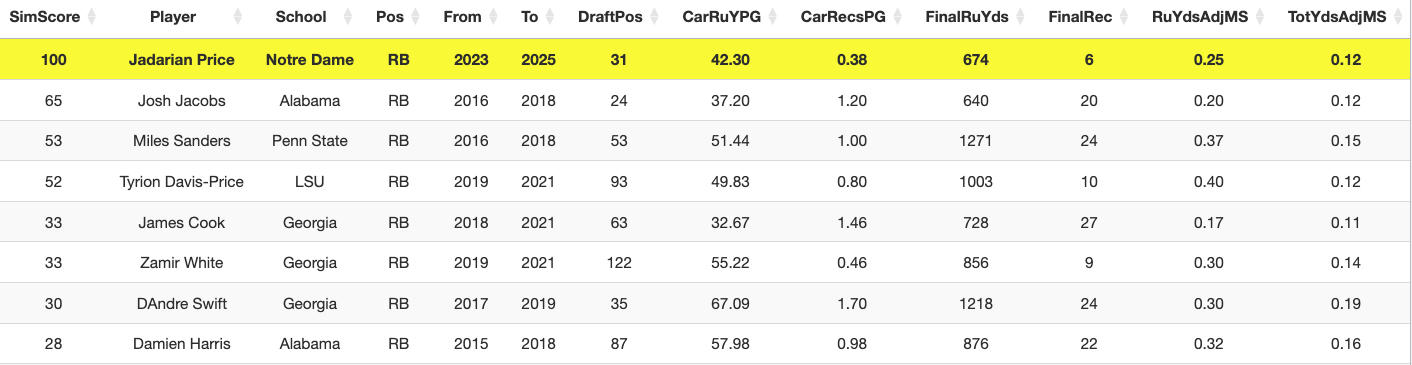
Price was expected to go early on Day 2, but the Seahawks took him at the end of the first round. Price’s analytical comparisons include some big-time running backs, like Josh Jacobs, Miles Sanders, James Cook, and D’Andre Swift.
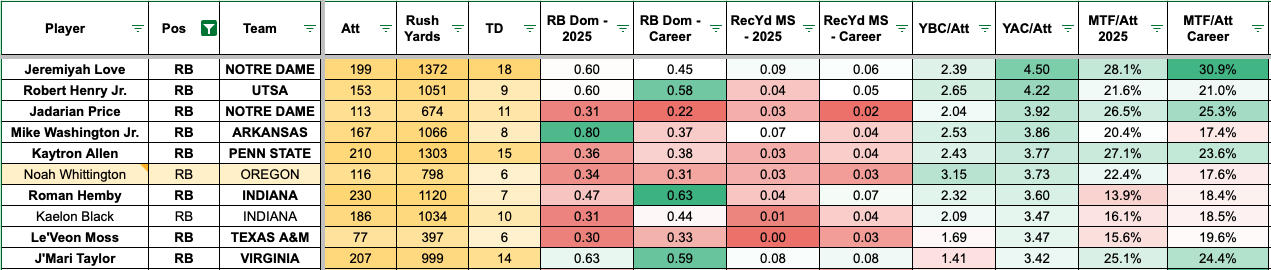
With any list or filter, there will be some busts like Tyrion Davis-Price and Zamir White, though Price’s draft capital was significantly higher. Price’s production and receiving profiles were underwhelming while playing alongside Jeremiyah Love, but Price flashed juicy rushing advanced stats.
In college, Price averaged 2.04 yards before contact per attempt (YBC/Att) and 3.92 yards after contact (YAC/Att). He had the third-highest YAC/Att among the rookie running backs. Furthermore, Price boasted an above-average 25.3% missed-tackle-forced rate (MTF/Att) throughout his career, ranking ninth in the class.
Though Price doesn’t have the peak season Kenneth Walker III did, the rookie’s underlying metrics and lack of collegiate receiving production feel reminiscent of the former Seahawks running back. Price has some pass-blocking concerns, but he should fit well into the Seahawks’ zone-rushing scheme. The Seahawks had the seventh-highest rush attempts in zone run concepts. Price had 59.3% of his attempts in zone runs.
Price should be a target at his cost, especially since there’s plenty to like in his rushing advanced stats profile.
Zach Charbonnet — 147 ADP, RB48
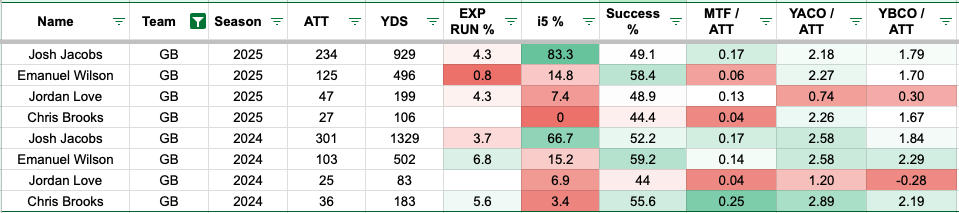
Last season, Charbonnet led the team in percentage of carries inside the five-yard line at 66.7%, ahead of Walker (27.6%). However, Walker had more explosive runs, with 8.1% of his rush attempts going for 15-plus yards compared to Charbonnet (4.9%). Charbonnet should maintain a high-value touch role in the Seahawks offense when he returns healthy.
The visual below shows the rushing advanced stats for the Seahawks rushers over the past two seasons.
Charbonnet was placed on the PUP list before training camp, though there’s still a chance the team activates him before the season starts. If the team activates him off the PUP list before the season starts, he won’t need to miss four games. It makes sense for the Seahawks to be cautious with Charbonnet because he is a valuable component of their offense.
Though the S2 running back in a small-gap backfield didn’t lead to higher win rates last season, the historical data indicates there’s a market edge to be exploited. Draft and stash Charbonnet while we have a discounted draft price.
George Holani — 207.8 ADP, RB70
Emanuel Wilson — 224 ADP, RB78
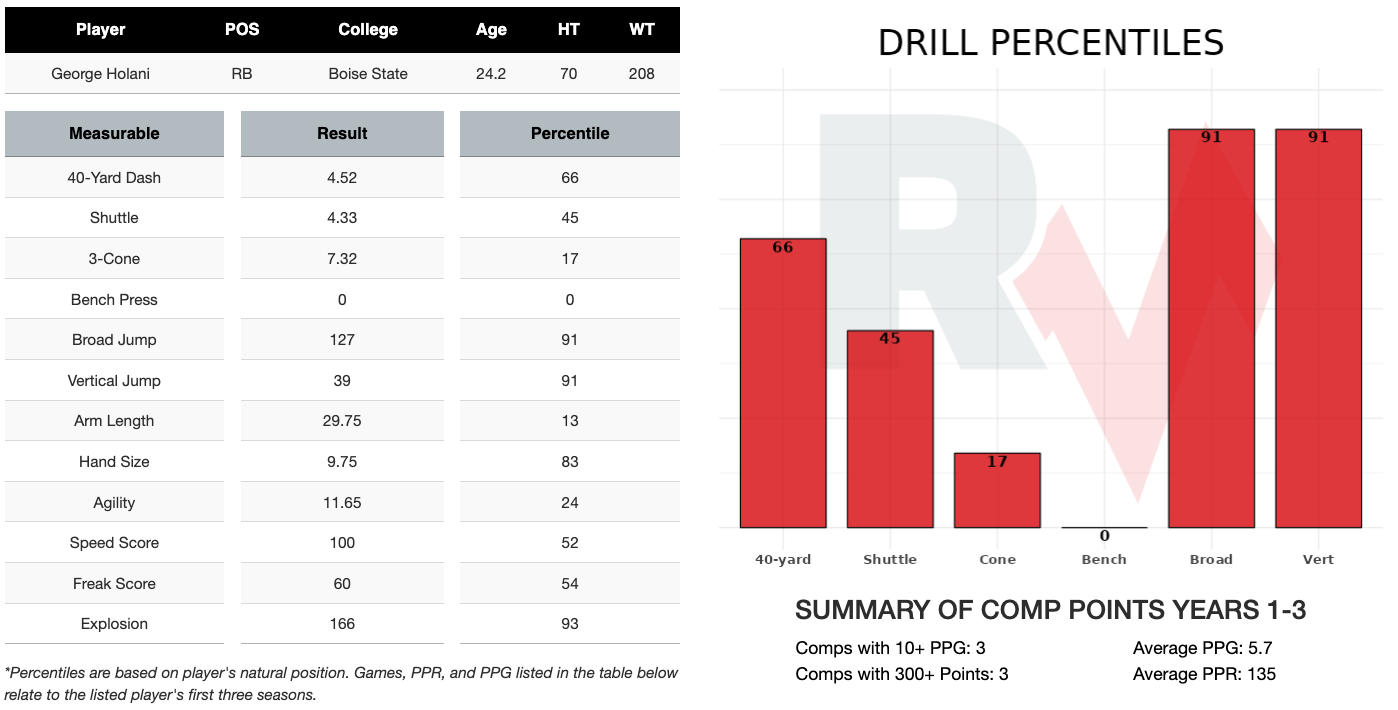
After having some optimism with Holani earlier in the offseason, it might be more valuable to invest in the S1 and S2 backs in the Seahawks’ backfield. With Holani you’re hoping for snaps and opportunities early in the season if Price falters and Charbonnet misses the first month or so. In college, Holani had a 7% receiving yardage market share, showing there’s a path as a third-down back.
Holani is an explosive athlete, evidenced by a 93rd-percentile explosion score. That could lead to efficient rushing production on limited touches, like a discounted version of Keaton Mitchell. There’s a small chance Holani can be trusted with 25% of the high-value touches that Charbonnet handled. However, that might be a dream scenario for Holani.
The Seahawks signed Wilson early in the offseason on a one-year deal worth $2.1 million. Wilson was an undrafted free agent in 2023 who took on over 100 rush attempts over the past two seasons in Green Bay. Wilson had a 58.4% rushing success rate while averaging 2.27 yards after contact last season.
He handled 10 or more rush attempts in five games last year, including two RB2 performances and a spike-week RB1 game in Week 12 against the Vikings (26.5 PPR). If the Seahawks hadn’t drafted Price, Wilson might be picking up steam as an early-down grinder in this backfield. It’s probably not worth drafting Wilson in most formats. However, keep tabs on him throughout the season, because he has shown high rushing success rates and fought for YAC/Att.

Sorting Through Small-Gap Backfields: The Seahawks, Titans, and Commanders
Obviously, we also keep a finger on the pulse of the shifting fantasy landscape. This is the focus of my ADP Heat Check series, which goes position by position and explains why fantasy managers should either be buying or selling fantasy’s biggest ADP risers and fallers:
The Other Shoe Finally Dropped
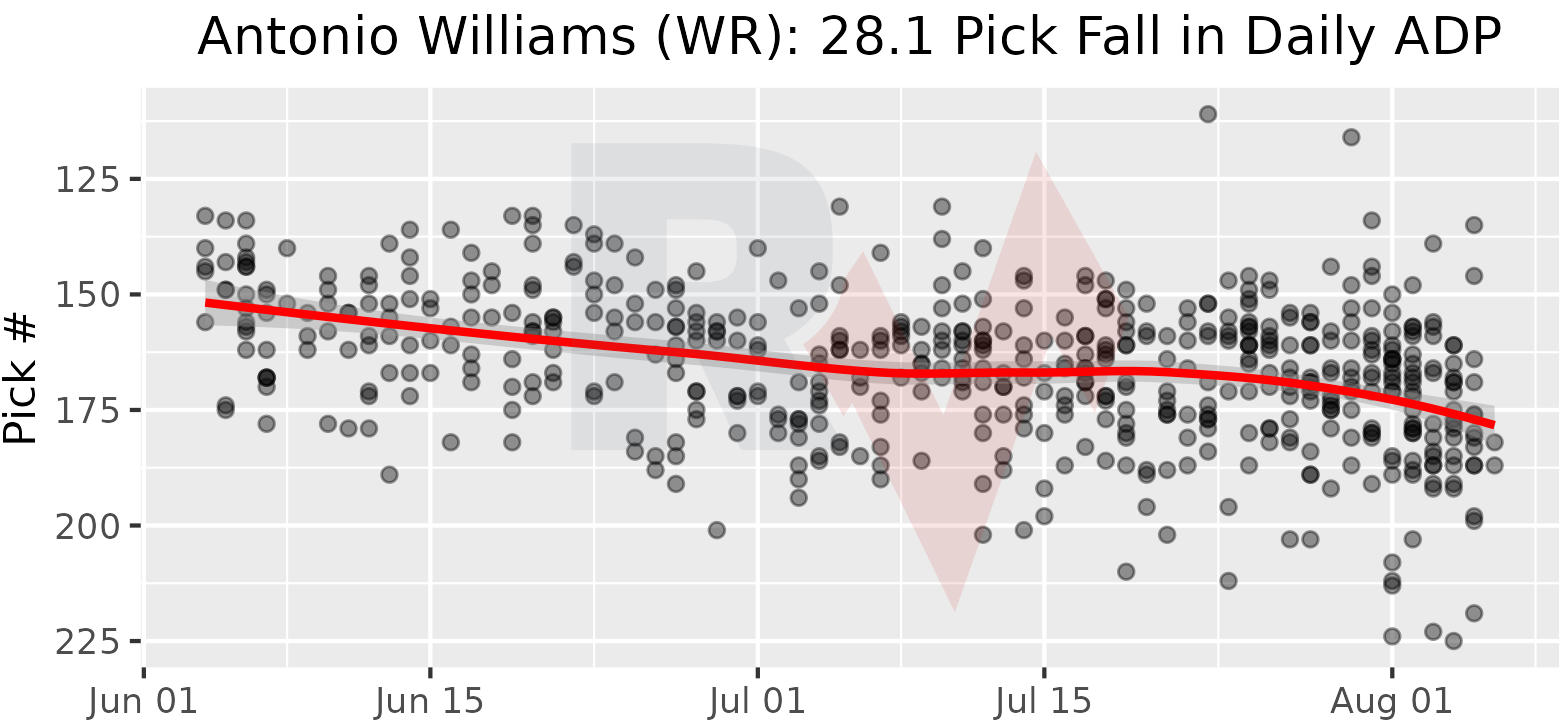
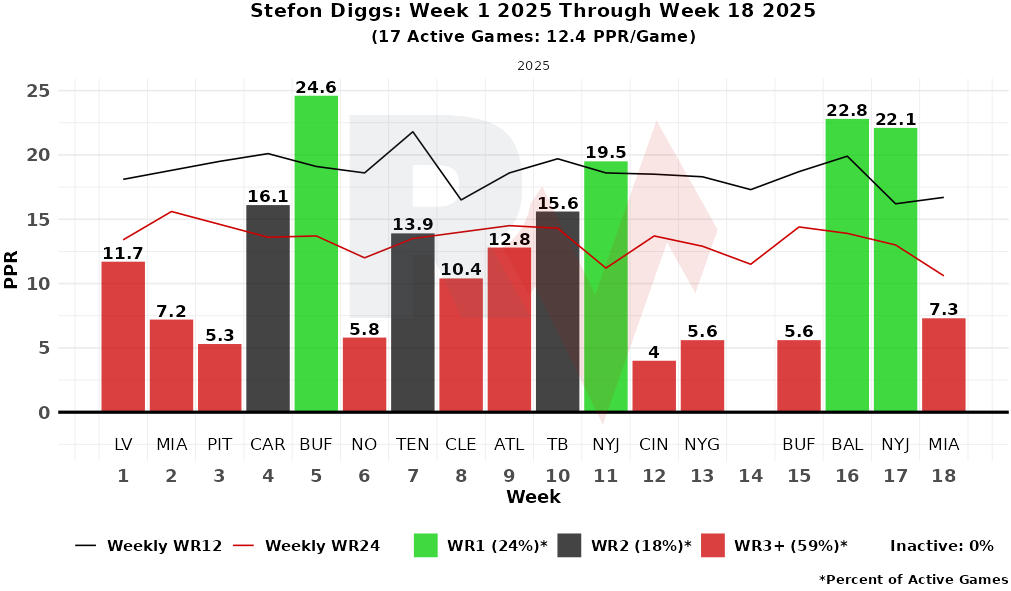
Stefon Diggs and Antonio Williams
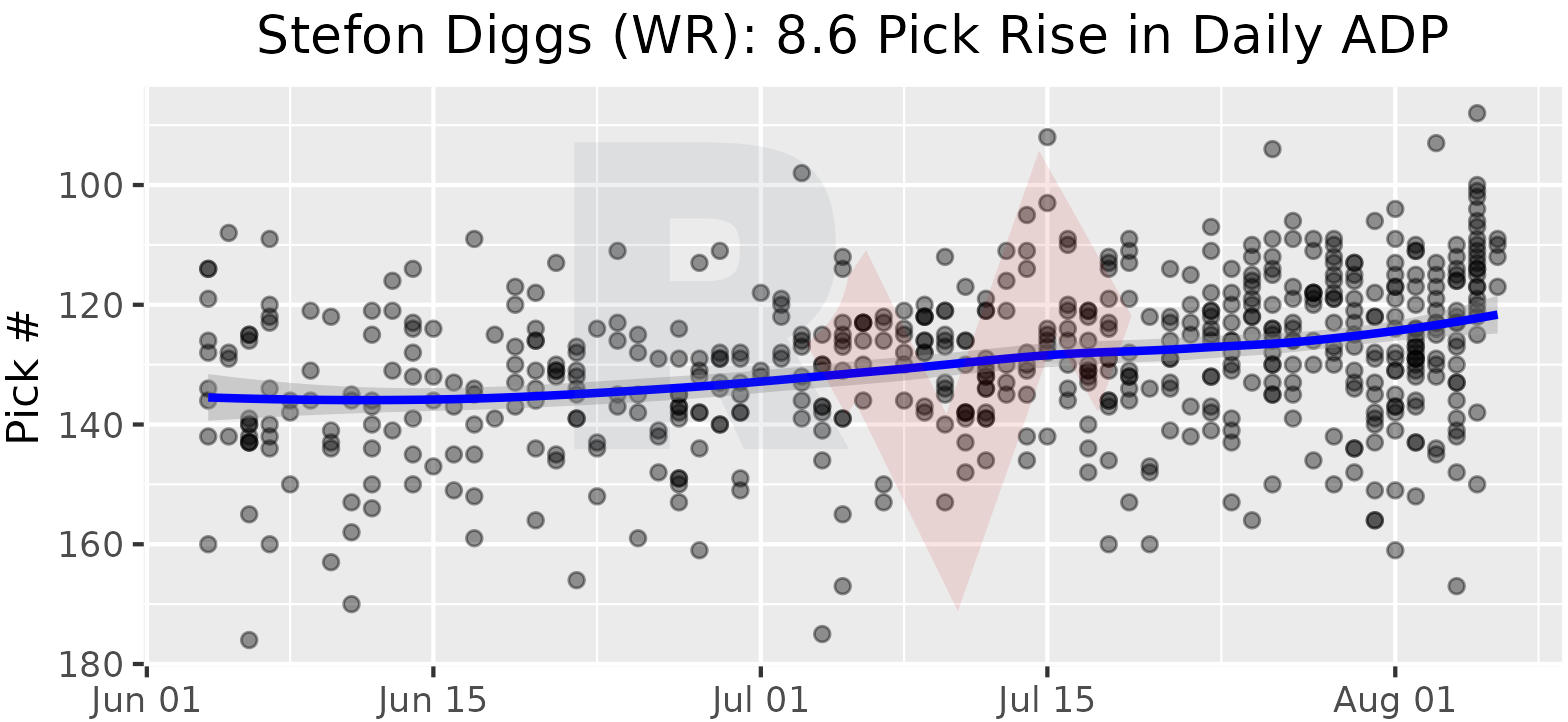
Even though the Stefon Diggs signing is still fresh, drafters have had an idea that a move was eventually going to come in Washington for a while now.
After Brandon Aiyuk started crashing out on social media, Diggs going to the Commanders began to feel like a reasonable outcome. While the veteran’s lone season in New England wasn’t always consistent, it was still strong enough to land him at PPR WR17 for the year.
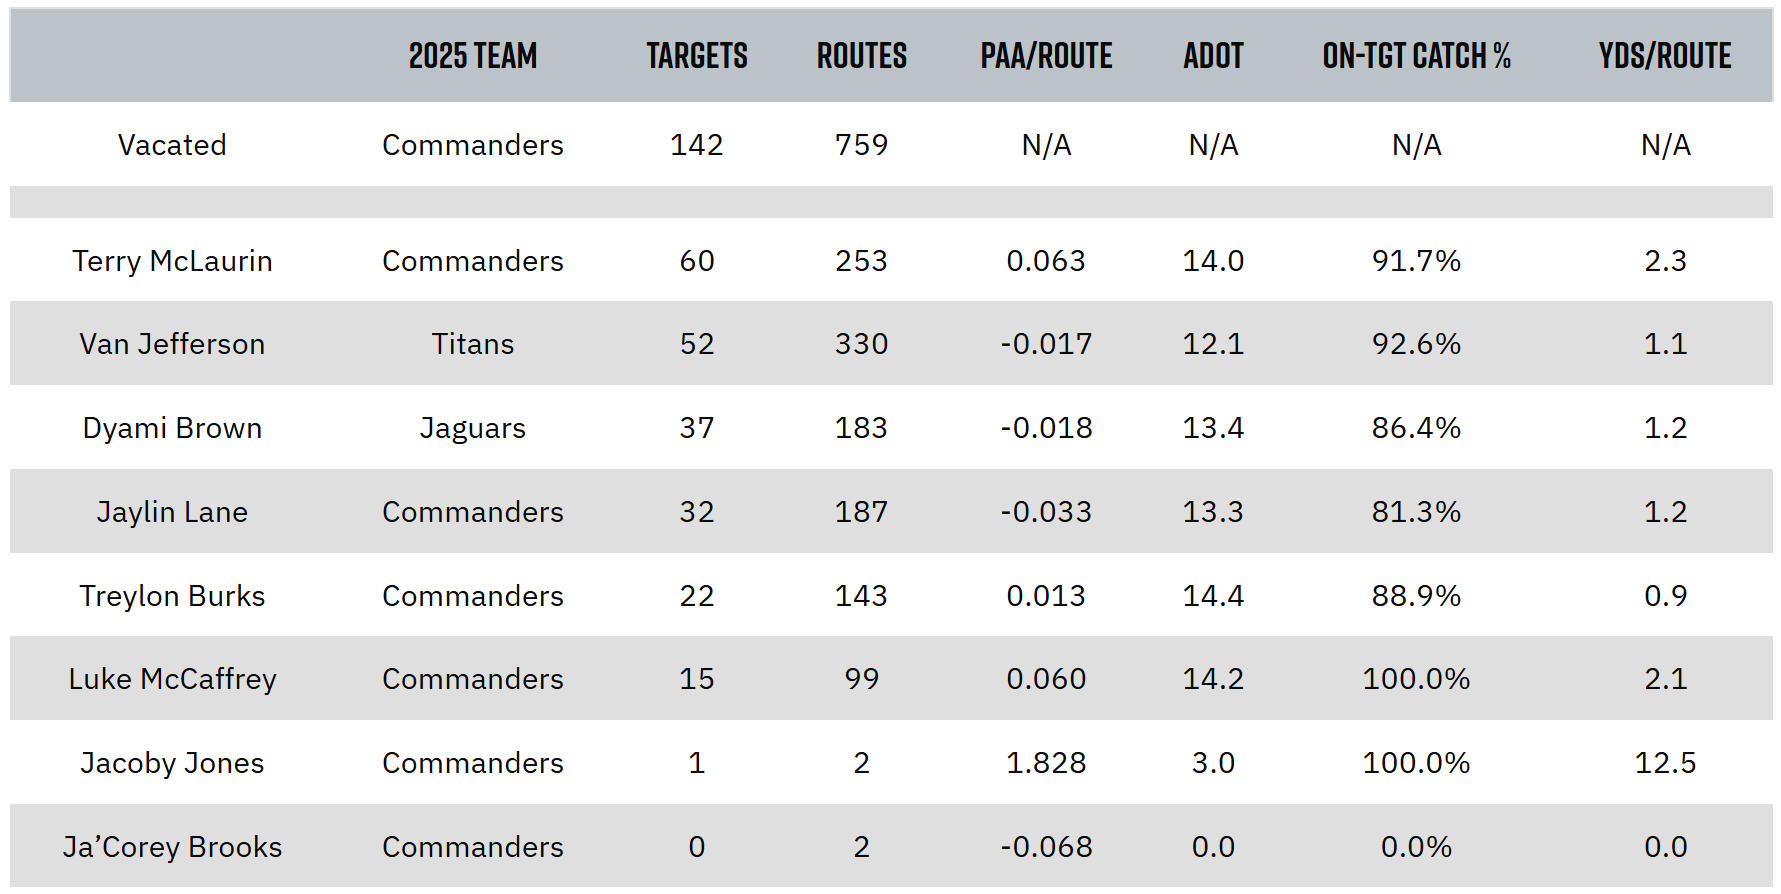
The 32-year-old Diggs will be relegated to the WR2 role in D.C., but he is surprisingly not much older than the team’s top target, 30-year-old Terry McLaurin. The skill sets of the two veterans should mesh well, as McLaurin thrives as an outside receiver who can attack defenses deep, while Diggs offers an inside/outside threat who operates in the short and intermediate areas.
Drafters are still banking on Williams as the Commanders’ WR3, but a lack of offseason buzz could result in the third-round rookie falling behind one of the other veterans on the roster.
As has been the case for a while, drafting Williams is a tough ask. If he does pop at any point this season, it will probably be long after he is dropped to waivers.
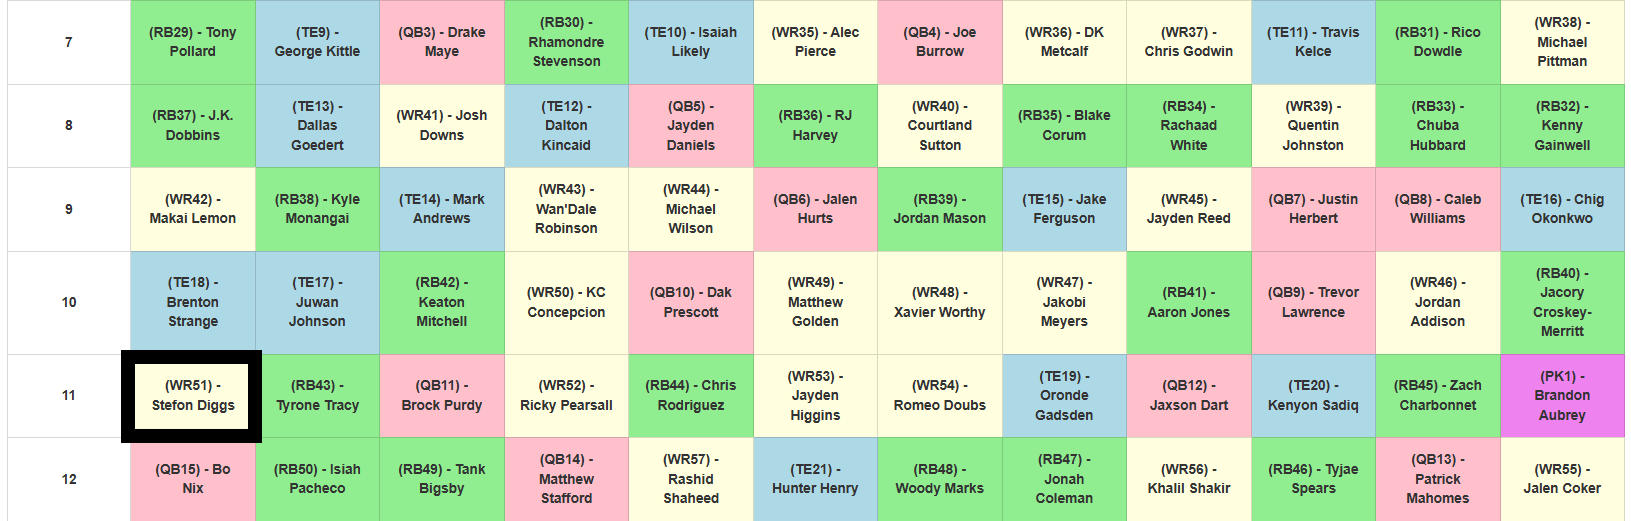
It remains to be seen how high Diggs will climb now that he is tied to Jayden Daniels. I think landing anywhere in the mid-to-low WR4 range is reasonable. If he climbs any higher than that, it will be time to reevaluate, with the most likely course of action being to fade him.
Going Overboard?
Quentin Johnston
A Mike McDaniel offense is one hell of a drug.
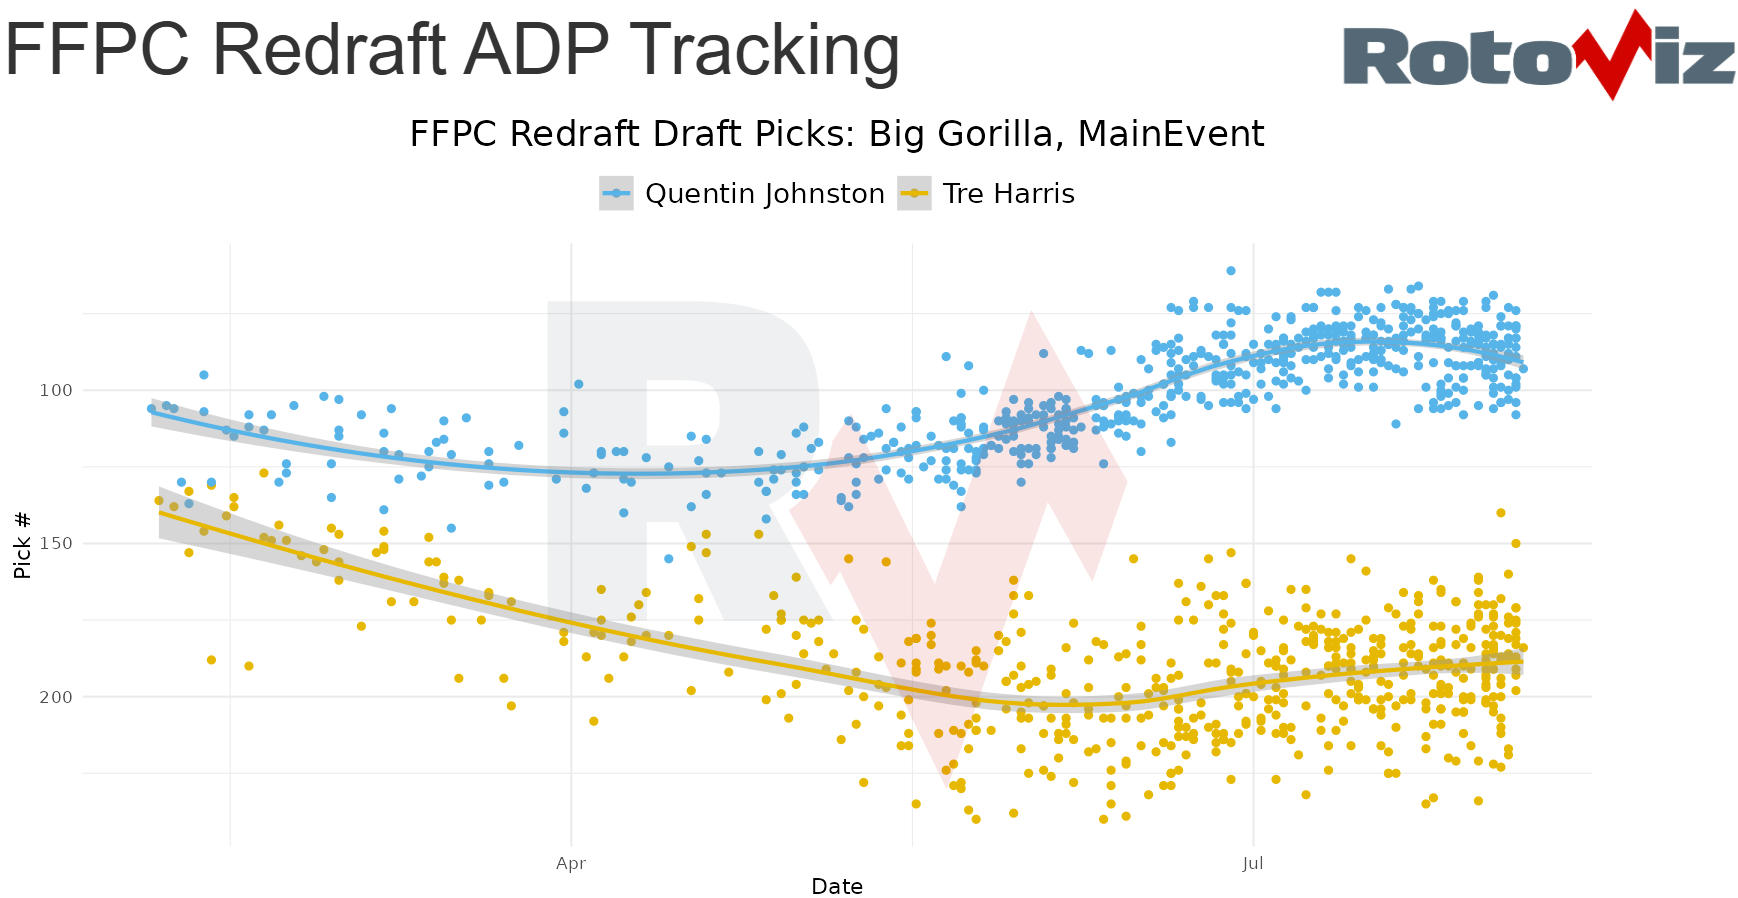
I was all over Quentin Johnston last year as a late-round arbitrage play for Tre’ Harris. One year later, the roles have been reversed, and so has my allegiance.
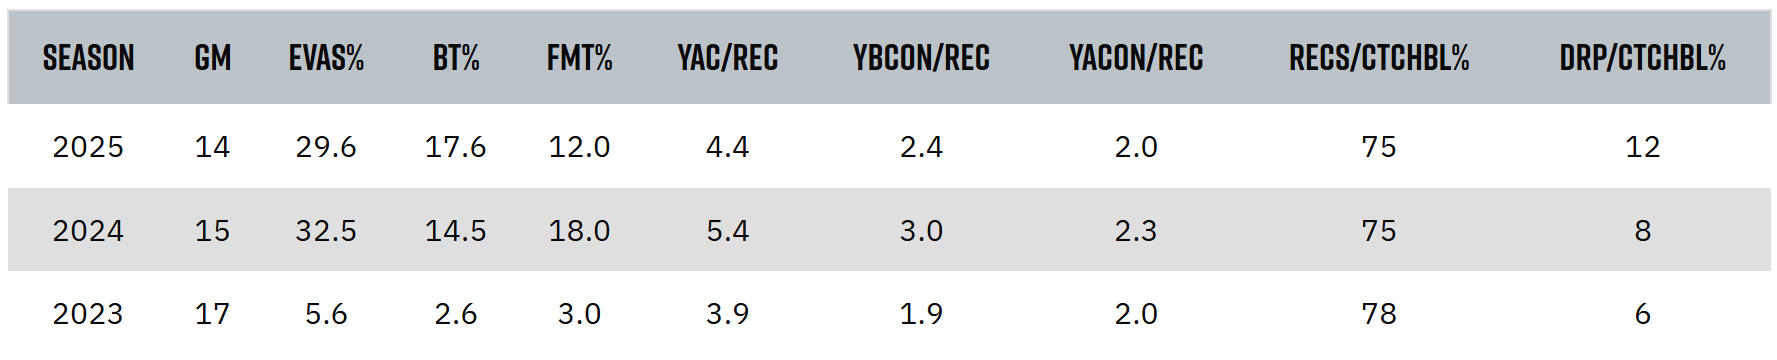
Granted, Johnston’s elite ability to slip tackles should be an asset in McDaniels’ system, although this aspect of his game is somewhat nullified by average YAC numbers. Meanwhile, his receptions per catchable target rate and drops per catchable target rate remained among the worst in the league.
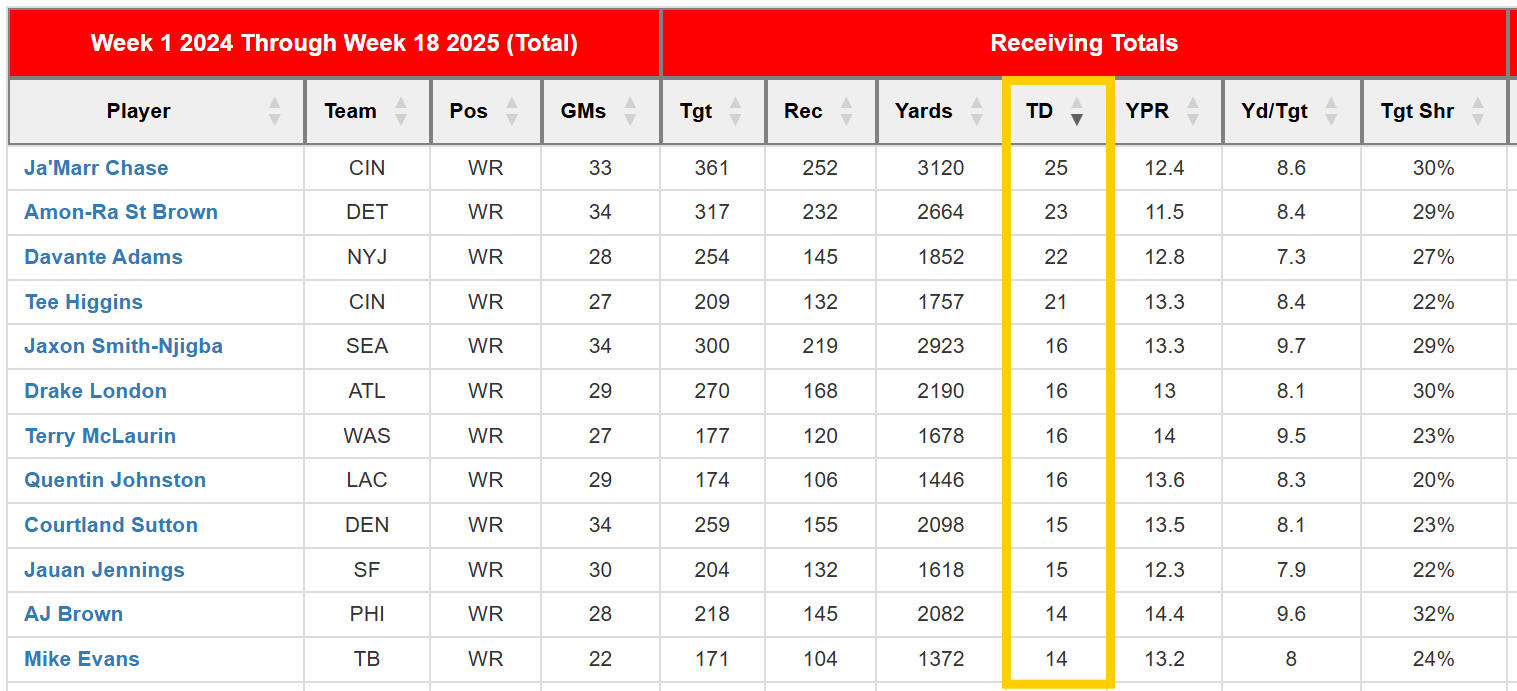
One factor that has helped Johnston rebound following an atrocious rookie year is his ability to reach the end zone. Over the past two years, Johnston’s 16 scores tie for fifth among WRs, while his receptions and yards both rank 38th.
With the Chargers’ receiving corps now being one of the most congested in the league, it is fair to question if Johnston’s one-dimensional skill set, unreliable hands, and recent TD luck are worthy of a selection early in the eighth round.
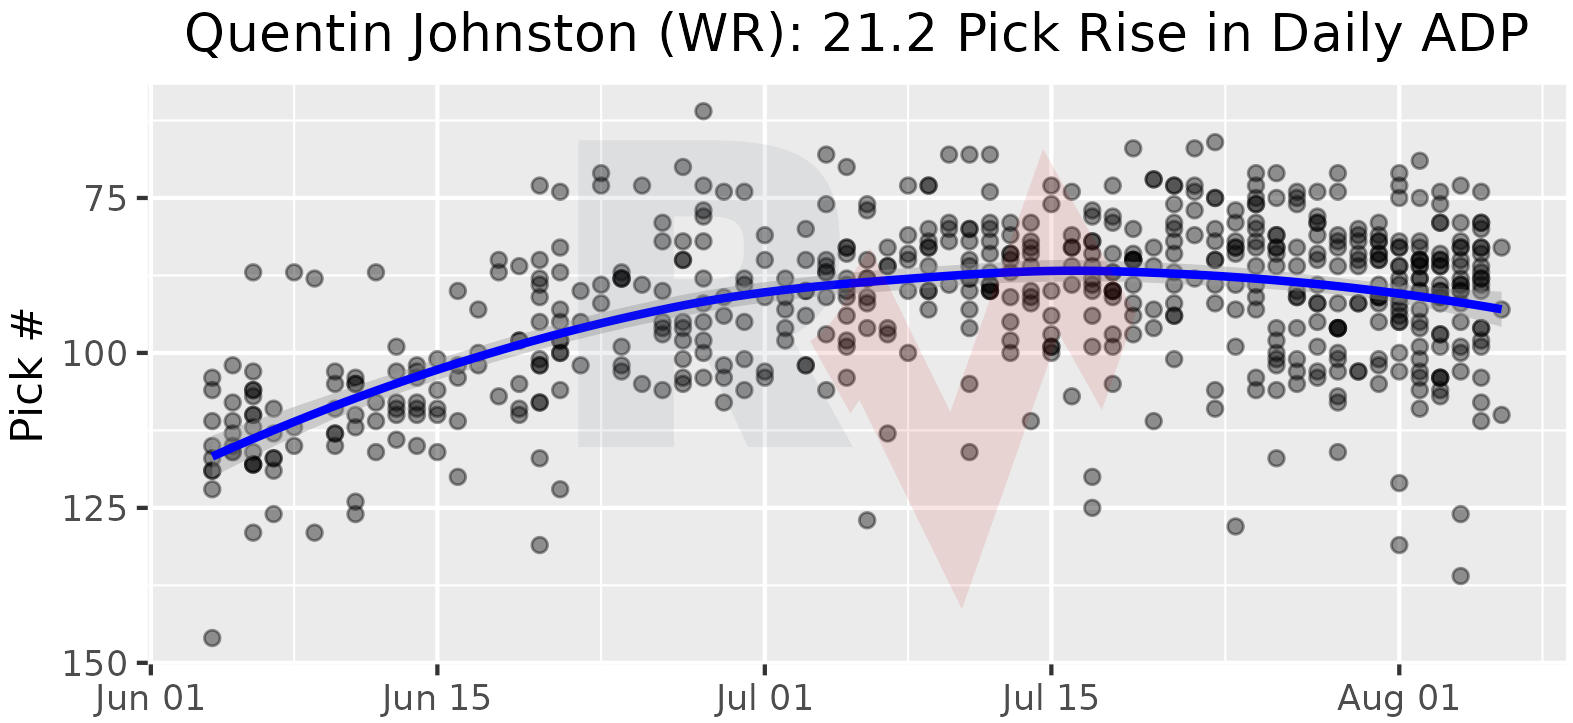
After Johnston’s price tag peaked in the middle of July, his ADP has begun to dip a bit over the past few weeks. Still, Johnston is overpriced by at least two rounds and has a very real chance of slipping down the Chargers’ depth chart this season.
It’s one thing to tell readers how to draft; it’s another thing to show them. That’s why we place a heavy emphasis on the practical application of the principles we preach. Whether it’s going contrarian with a zero-RB best ball build or following historical trends in single-QB and superflex leagues, it is always important to see how research can be applied in a real-world setting.
One of the most recent examples of this is the four-man dynasty startup I took part in alongside Hasan, Blair, and Jesse. In the latest installment of the Untimelies, Jesse shows how we got the board to flex to us while practicing what is quickly becoming a tenet of the RotoViz dynasty strategy, Zero-QB:
And unexpectedly answers drop into my lap, a little hail of ice and wisdom, of solved problems.
— Nietzsche, The Case of Wagner, §1
Round 1-9 Recap
As Blair covered in Part I and Part II, the first nine rounds of our quad-managed FFPC RotoViz Triflex Empire Startup went pretty well. We drafted eight skill-position players worth at least a first per the Consensus RotoViz Tiers, while acquiring a boatload of future draft capital, plus C.J. Stroud.
Right after we took Stroud at 8.07, the other team waiting on QB — everyone else had at least two by the end of round 7 — took Matthew Stafford, Daniel Jones, and Ty Simpson at picks 8.11, 9.01 and 9.02. Undaunted, we selected Xavier Worthy at 9.03 instead of taking the last starting QB with real job security in Sam Darnold.
Round 10
Then we waited.
Round 11
And waited some more.
RotoViz may be the original home of zero-RB, but these days we are just as likely to execute a zero-QB build — especially in FFPC superflex formats. If you’re willing to plug your nose and take the guy that everyone has decided “sucks,” profit often abounds. Just ask Jared, Sam, Baker, Geno, Brock, Daniel, Ryan and Tyler.
Round 12
The other reason to go zero-QB? The board flexes in your favor.
And so it did for us. After taking Stroud about 17 picks after ADP at 8.07, Bryce Young fell about 45 picks to us at 12.07. We thought about trading up but didn’t feel particularly motivated with every other squad already rostering at least two QBs and FFPC rules imposing a limit of three QBs per team in the startup.
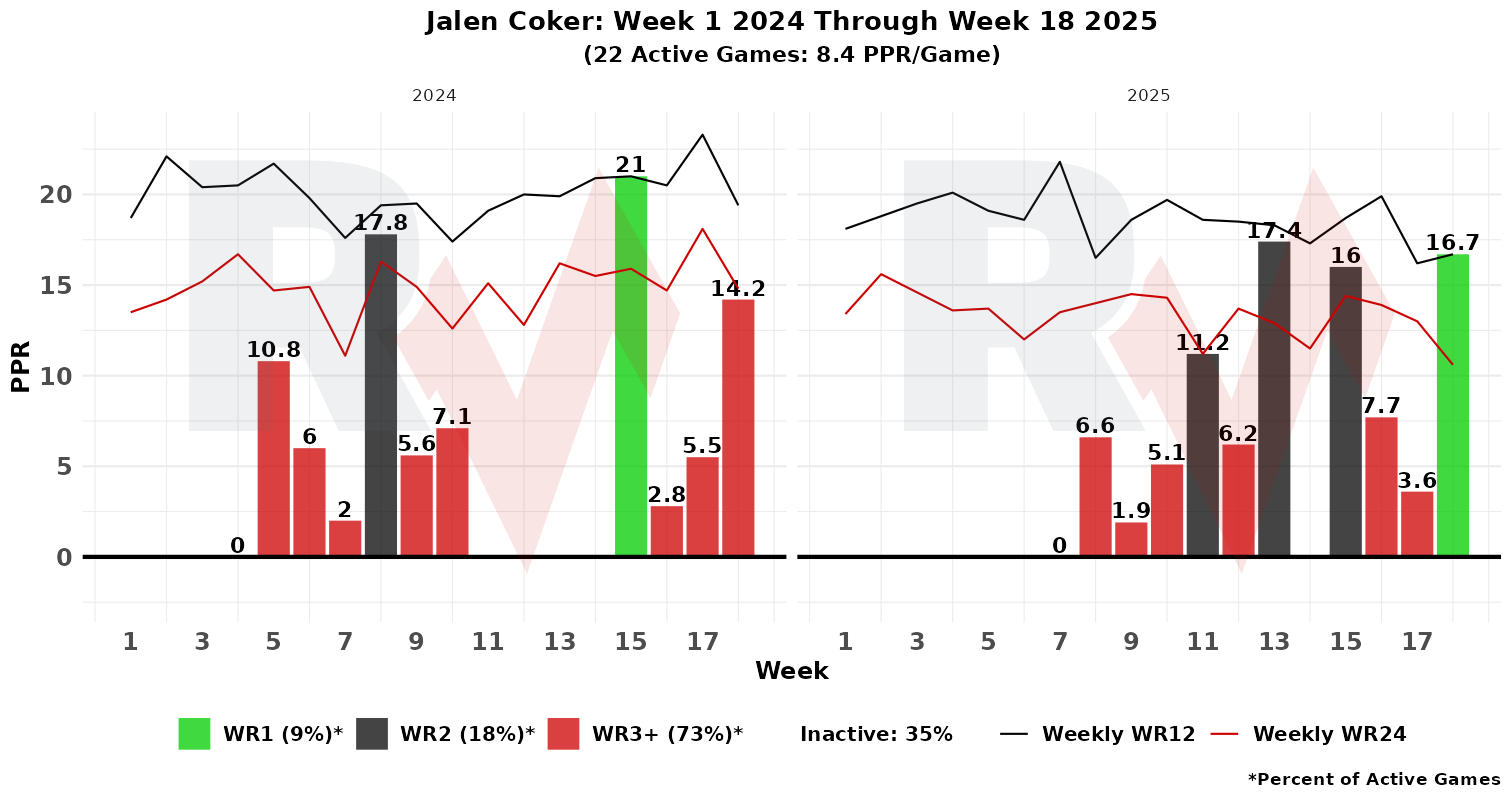
Young also set up our next pick, Jalen Coker at 12.10. Blair and Kevin were some of the earliest Cokeheads I know, making this a natural selection. I’m a little less sanguine on Coker — whose guarantees on signing his latest contract are in the Josh Palmer/Jahan Dotson range — than the others. But I can also see the upside, especially if Tetairoa McMillan doesn’t take the step we expect in 2026 (on the foot that still hurts from last year), and he pairs perfectly with Bryce.
The Untimelies, Part III: Why the Board Flexes to Us in Startups
While much of the fantasy community’s focus is centered on redraft and best ball, we refuse to leave our devoted dynasty players out in the cold. Jesse has put in a ton of work this summer to develop the new RotoViz Consensus Tiers, Dynasty Trade Calculator, and league reports. The latest innovation has been the introduction of Dynasty Buy Score:
Back in the Lab
After dropping the RotoViz Trade Calculator and Dynasty League Report tools in May, we’re back in the lab working on a portfolio management app that comes jam-packed with dynasty tools.
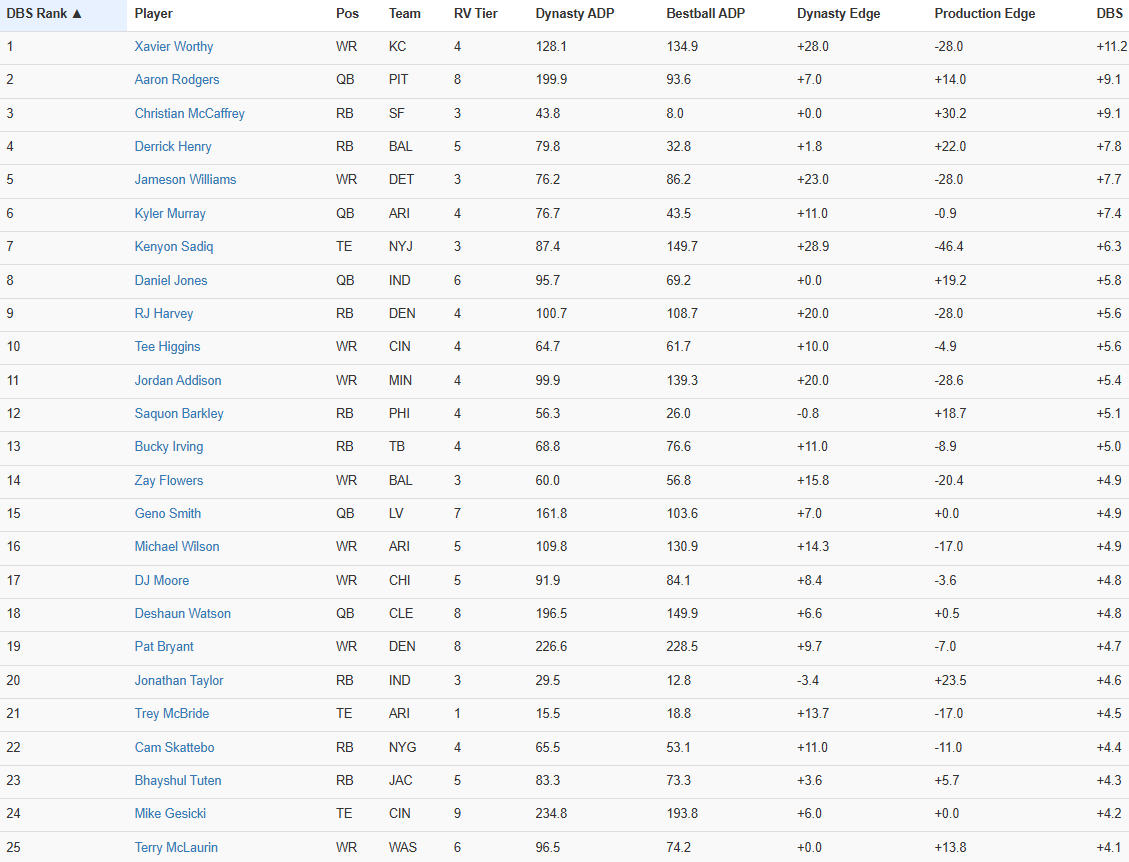
One such tool is the new Dynasty Buy Score (DBS), which triangulates RV Tier value, dynasty startup ADP, and bestball ADP into a single actionable score. It works by mapping the ADPs onto a pooled market curve, then scoring how far a player sits above or below that curve relative to their RV Tier. It then calculates a score made up of:
- 70% “dynasty edge,” where a positive score means RotoViz is more bullish than the dynasty market; and
- 30% “production edge,” where a positive score means best ball ADP suggests more current-season production than the RV Tier implies.
The reason for the ‘dynasty edge’ metric and its supremacy in the calculation is obvious. ‘Production edge’ is a bit counterintuitive (we don’t typically want to pay for points per se), but scoring tends to keep dynasty value afloat, not to mention winning championships.
We look forward to releasing the full portfolio management app soon. In the meantime, here’s a review of our DBS leaders as of July 17, 2026.
The Leaderboards
The DBS leaderboard (Triflex) is a who’s who of RotoViz darlings and league-winners:
The examples above are just a small sample of what RotoViz has to offer. Our team is diving into the data every day to provide fantasy managers with the research and analysis to not only win their leagues in 2026 but also be a step ahead of the competition for years to come.
And once we get to the regular season, you can expect the same level of in-depth analysis and attention to detail that readers have come to expect from RotoViz.
Not a subcriber? Sign up now and benefit from the best tools, analysis, and advanced data that the fantasy industry has to offer!
Footnotes
| ↑1 | I.e., more guys who work in the short area of the field. The names that were dropped from the analysis by switching from raw CT% are discussed below. |
|---|---|
| ↑2 | I’ve only included the top-five names on the list here. If you want the other 17, you’ll have to read the article. |
| ↑3 | And in FPOE. |
| ↑4 | Also 2022 and 2023. |


